
 Yahoo Finance
 How Does Polaris Infrastructure's (TSE:PIF) P/E Compare To Its Industry, After The Share Price Drop?

Unfortunately for some shareholders, the Polaris Infrastructure (TSE:PIF) share price has dived 37% in the last thirty days. Looking back further, the stock is up 3.3% in the last year.
All else being equal, a share price drop should make a stock more attractive to potential investors. While the market sentiment towards a stock is very changeable, in the long run, the share price will tend to move in the same direction as earnings per share. So, on certain occasions, long term focussed investors try to take advantage of pessimistic expectations to buy shares at a better price. One way to gauge market expectations of a stock is to look at its Price to Earnings Ratio (PE Ratio). Investors have optimistic expectations of companies with higher P/E ratios, compared to companies with lower P/E ratios.
See our latest analysis for Polaris Infrastructure
How Does Polaris Infrastructure's P/E Ratio Compare To Its Peers?
Polaris Infrastructure's P/E of 8.57 indicates relatively low sentiment towards the stock. The image below shows that Polaris Infrastructure has a lower P/E than the average (17.9) P/E for companies in the renewable energy industry.
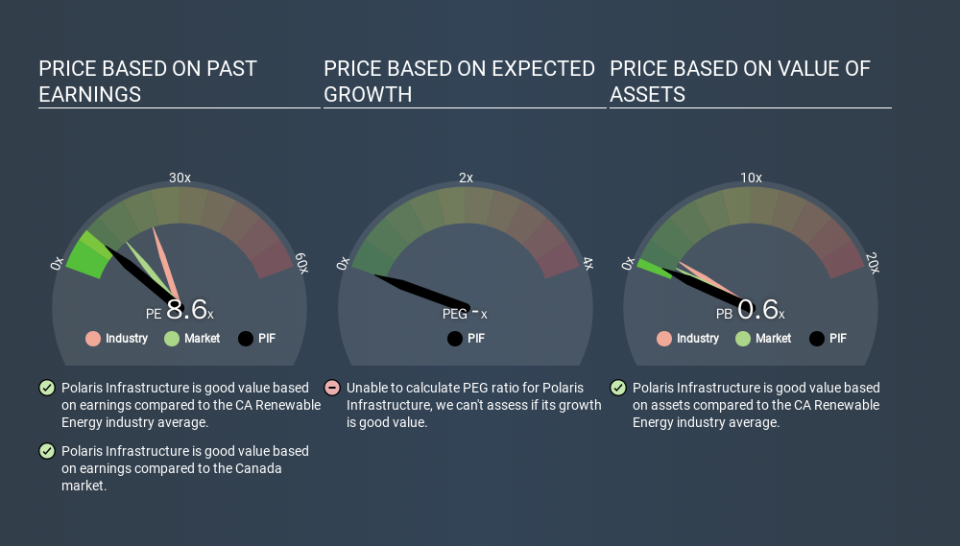
This suggests that market participants think Polaris Infrastructure will underperform other companies in its industry. While current expectations are low, the stock could be undervalued if the situation is better than the market assumes. It is arguably worth checking if insiders are buying shares, because that might imply they believe the stock is undervalued.
How Growth Rates Impact P/E Ratios
Generally speaking the rate of earnings growth has a profound impact on a company's P/E multiple. If earnings are growing quickly, then the 'E' in the equation will increase faster than it would otherwise. And in that case, the P/E ratio itself will drop rather quickly. A lower P/E should indicate the stock is cheap relative to others -- and that may attract buyers.
Polaris Infrastructure saw earnings per share decrease by 16% last year.
Don't Forget: The P/E Does Not Account For Debt or Bank Deposits
It's important to note that the P/E ratio considers the market capitalization, not the enterprise value. Thus, the metric does not reflect cash or debt held by the company. Theoretically, a business can improve its earnings (and produce a lower P/E in the future) by investing in growth. That means taking on debt (or spending its cash).
Such spending might be good or bad, overall, but the key point here is that you need to look at debt to understand the P/E ratio in context.
How Does Polaris Infrastructure's Debt Impact Its P/E Ratio?
Polaris Infrastructure has net debt worth a very significant 122% of its market capitalization. If you want to compare its P/E ratio to other companies, you must keep in mind that these debt levels would usually warrant a relatively low P/E.
The Bottom Line On Polaris Infrastructure's P/E Ratio
Polaris Infrastructure's P/E is 8.6 which is below average (11.6) in the CA market. When you consider that the company has significant debt, and didn't grow EPS last year, it isn't surprising that the market has muted expectations. What can be absolutely certain is that the market has become more pessimistic about Polaris Infrastructure over the last month, with the P/E ratio falling from 13.6 back then to 8.6 today. For those who prefer to invest with the flow of momentum, that might be a bad sign, but for deep value investors this stock might justify some research.
When the market is wrong about a stock, it gives savvy investors an opportunity. If it is underestimating a company, investors can make money by buying and holding the shares until the market corrects itself. So this free report on the analyst consensus forecasts could help you make a master move on this stock.
Of course you might be able to find a better stock than Polaris Infrastructure. So you may wish to see this free collection of other companies that have grown earnings strongly.
If you spot an error that warrants correction, please contact the editor at editorial-team@simplywallst.com. This article by Simply Wall St is general in nature. It does not constitute a recommendation to buy or sell any stock, and does not take account of your objectives, or your financial situation. Simply Wall St has no position in the stocks mentioned.
We aim to bring you long-term focused research analysis driven by fundamental data. Note that our analysis may not factor in the latest price-sensitive company announcements or qualitative material. Thank you for reading.
