
 Yahoo Finance
 Does Pine Cliff Energy Ltd.’s (TSE:PNE) CEO Salary Compare Well With Others?

Phil Hodge became the CEO of Pine Cliff Energy Ltd. (TSE:PNE) in 2012. This report will, first, examine the CEO compensation levels in comparison to CEO compensation at companies of similar size. Then we’ll look at a snap shot of the business growth. And finally we will reflect on how common stockholders have fared in the last few years, as a secondary measure of performance. This process should give us an idea about how appropriately the CEO is paid.
Check out our latest analysis for Pine Cliff Energy
How Does Phil Hodge’s Compensation Compare With Similar Sized Companies?
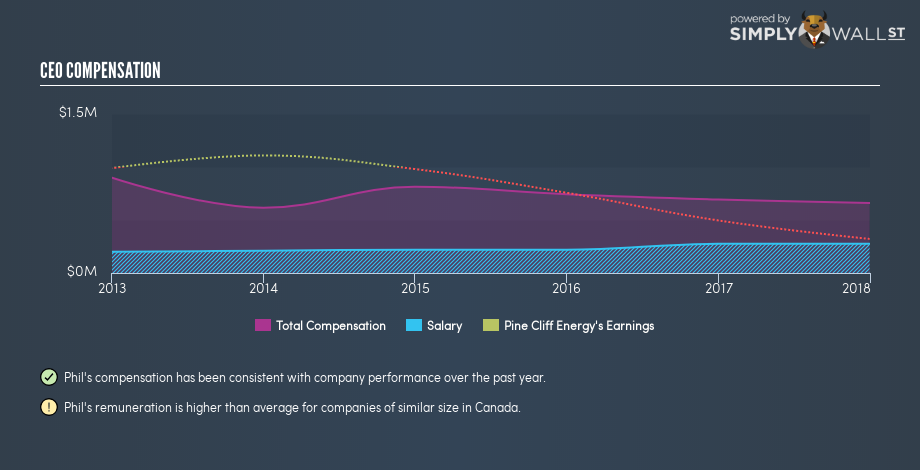
According to our data, Pine Cliff Energy Ltd. has a market capitalization of CA$83m, and pays its CEO total annual compensation worth CA$660k. (This figure is for the year to 2017). We think total compensation is more important but we note that the CEO salary is lower, at CA$275k. We took a group of companies with market capitalizations below CA$268m, and calculated the median CEO compensation to be CA$158k.
It would therefore appear that Pine Cliff Energy Ltd. pays Phil Hodge more than the median CEO remuneration at companies of a similar size, in the same market. However, this fact alone doesn’t mean the remuneration is too high. A closer look at the performance of the underlying business will give us a better idea about whether the pay is particularly generous.
You can see a visual representation of the CEO compensation at Pine Cliff Energy, below.
Is Pine Cliff Energy Ltd. Growing?
Over the last three years Pine Cliff Energy Ltd. has shrunk its earnings per share by an average of 27% per year. In the last year, its revenue is down -24%.
Unfortunately, earnings per share have trended lower over the last three years. And the fact that revenue is down year on year arguably paints an ugly picture. So given this relatively weak performance, shareholders would probably not want to see high compensation for the CEO.
It could be important to check this free visual depiction of what analysts expect for the future.
Has Pine Cliff Energy Ltd. Been A Good Investment?
With a three year total loss of 69%, Pine Cliff Energy Ltd. would certainly have some dissatisfied shareholders. So shareholders would probably think the company shouldn’t be too generous with CEO compensation.
In Summary…
We compared total CEO remuneration at Pine Cliff Energy Ltd. with the amount paid at companies with a similar market capitalization. Our data suggests that it pays above the median CEO pay within that group.
We think many shareholders would be underwhelmed with the business growth over the last three years.
Arguably worse, investors are without a positive return for the last three years. This analysis suggests to us that the CEO is paid too generously! Whatever your view on compensation, you might want to check if insiders are buying or selling Pine Cliff Energy shares (free trial).
Or you might prefer gaze upon this detailed graph of past earnings, revenue and cash flow .
To help readers see past the short term volatility of the financial market, we aim to bring you a long-term focused research analysis purely driven by fundamental data. Note that our analysis does not factor in the latest price-sensitive company announcements.
The author is an independent contributor and at the time of publication had no position in the stocks mentioned. For errors that warrant correction please contact the editor at editorial-team@simplywallst.com.
