
 Yahoo Finance
 How Does Peyto Exploration & Development's (TSE:PEY) P/E Compare To Its Industry, After Its Big Share Price Gain?

Peyto Exploration & Development (TSE:PEY) shares have had a really impressive month, gaining 33%, after some slippage. But shareholders may not all be feeling jubilant, since the share price is still down 48% in the last year.
All else being equal, a sharp share price increase should make a stock less attractive to potential investors. While the market sentiment towards a stock is very changeable, in the long run, the share price will tend to move in the same direction as earnings per share. The implication here is that deep value investors might steer clear when expectations of a company are too high. One way to gauge market expectations of a stock is to look at its Price to Earnings Ratio (PE Ratio). Investors have optimistic expectations of companies with higher P/E ratios, compared to companies with lower P/E ratios.
View our latest analysis for Peyto Exploration & Development
How Does Peyto Exploration & Development's P/E Ratio Compare To Its Peers?
We can tell from its P/E ratio of 4.04 that sentiment around Peyto Exploration & Development isn't particularly high. We can see in the image below that the average P/E (10.9) for companies in the oil and gas industry is higher than Peyto Exploration & Development's P/E.
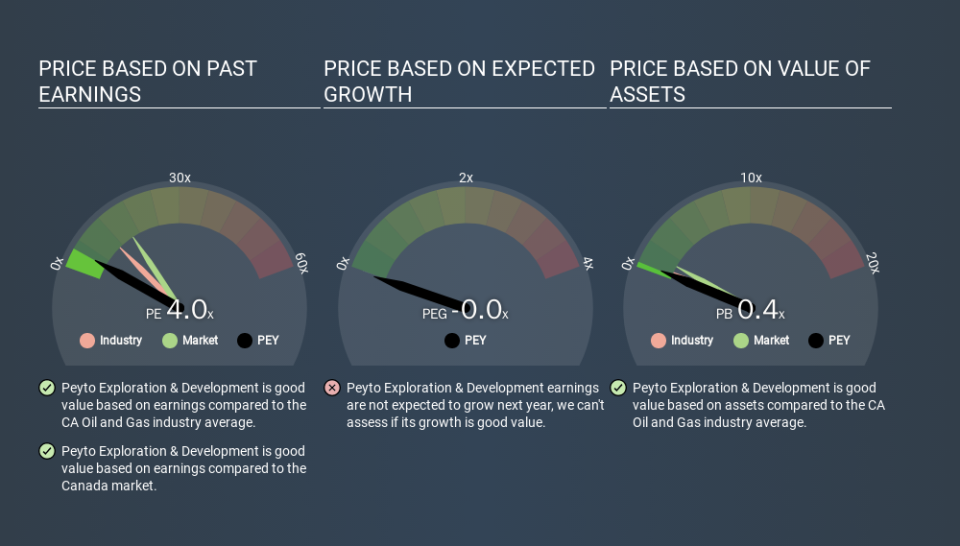
Peyto Exploration & Development's P/E tells us that market participants think it will not fare as well as its peers in the same industry. Many investors like to buy stocks when the market is pessimistic about their prospects. If you consider the stock interesting, further research is recommended. For example, I often monitor director buying and selling.
How Growth Rates Impact P/E Ratios
Earnings growth rates have a big influence on P/E ratios. When earnings grow, the 'E' increases, over time. And in that case, the P/E ratio itself will drop rather quickly. Then, a lower P/E should attract more buyers, pushing the share price up.
Peyto Exploration & Development's earnings per share fell by 4.9% in the last twelve months. But EPS is up 8.1% over the last 3 years. And over the longer term (5 years) earnings per share have decreased 9.6% annually. So you wouldn't expect a very high P/E.
A Limitation: P/E Ratios Ignore Debt and Cash In The Bank
The 'Price' in P/E reflects the market capitalization of the company. Thus, the metric does not reflect cash or debt held by the company. The exact same company would hypothetically deserve a higher P/E ratio if it had a strong balance sheet, than if it had a weak one with lots of debt, because a cashed up company can spend on growth.
While growth expenditure doesn't always pay off, the point is that it is a good option to have; but one that the P/E ratio ignores.
Is Debt Impacting Peyto Exploration & Development's P/E?
Peyto Exploration & Development has net debt worth a very significant 185% of its market capitalization. This is a relatively high level of debt, so the stock probably deserves a relatively low P/E ratio. Keep that in mind when comparing it to other companies.
The Bottom Line On Peyto Exploration & Development's P/E Ratio
Peyto Exploration & Development has a P/E of 4.0. That's below the average in the CA market, which is 15.8. Given meaningful debt, and a lack of recent growth, the market looks to be extrapolating this recent performance; reflecting low expectations for the future. What we know for sure is that investors are becoming less uncomfortable about Peyto Exploration & Development's prospects, since they have pushed its P/E ratio from 3.0 to 4.0 over the last month. If you like to buy stocks that could be turnaround opportunities, then this one might be a candidate; but if you're more sensitive to price, then you may feel the opportunity has passed.
Investors should be looking to buy stocks that the market is wrong about. If it is underestimating a company, investors can make money by buying and holding the shares until the market corrects itself. So this free visual report on analyst forecasts could hold the key to an excellent investment decision.
Of course you might be able to find a better stock than Peyto Exploration & Development. So you may wish to see this free collection of other companies that have grown earnings strongly.
If you spot an error that warrants correction, please contact the editor at editorial-team@simplywallst.com. This article by Simply Wall St is general in nature. It does not constitute a recommendation to buy or sell any stock, and does not take account of your objectives, or your financial situation. Simply Wall St has no position in the stocks mentioned.
We aim to bring you long-term focused research analysis driven by fundamental data. Note that our analysis may not factor in the latest price-sensitive company announcements or qualitative material. Thank you for reading.
