
 Yahoo Finance
 Does Perficient, Inc.'s (NASDAQ:PRFT) Past Performance Indicate A Stronger Future?

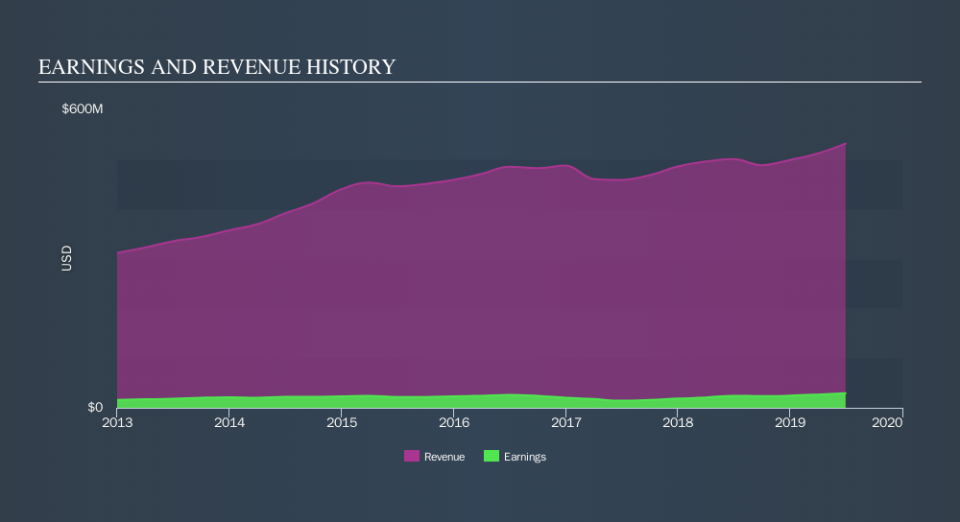
When Perficient, Inc. (NasdaqGS:PRFT) released its most recent earnings update (30 June 2019), I compared it against two factor: its historical earnings track record, and the performance of its industry peers on average. Being able to interpret how well Perficient has done so far requires weighing its performance against a benchmark, rather than looking at a standalone number at a point in time. In this article, I've summarized the key takeaways on how I see PRFT has performed.
See our latest analysis for Perficient
How Well Did PRFT Perform?
PRFT's trailing twelve-month earnings (from 30 June 2019) of US$29m has jumped 21% compared to the previous year.
Furthermore, this one-year growth rate has exceeded its 5-year annual growth average of 1.2%, indicating the rate at which PRFT is growing has accelerated. How has it been able to do this? Well, let’s take a look at if it is only due to industry tailwinds, or if Perficient has seen some company-specific growth.
In terms of returns from investment, Perficient has fallen short of achieving a 20% return on equity (ROE), recording 8.2% instead. Furthermore, its return on assets (ROA) of 5.9% is below the US IT industry of 6.0%, indicating Perficient's are utilized less efficiently. And finally, its return on capital (ROC), which also accounts for Perficient’s debt level, has declined over the past 3 years from 10.0% to 8.8%. This correlates with an increase in debt holding, with debt-to-equity ratio rising from 25% to 34% over the past 5 years.
What does this mean?
Perficient's track record can be a valuable insight into its earnings performance, but it certainly doesn't tell the whole story. Companies that have performed well in the past, such as Perficient gives investors conviction. However, the next step would be to assess whether the future looks as optimistic. I recommend you continue to research Perficient to get a better picture of the stock by looking at:
Future Outlook: What are well-informed industry analysts predicting for PRFT’s future growth? Take a look at our free research report of analyst consensus for PRFT’s outlook.
Financial Health: Are PRFT’s operations financially sustainable? Balance sheets can be hard to analyze, which is why we’ve done it for you. Check out our financial health checks here.
Other High-Performing Stocks: Are there other stocks that provide better prospects with proven track records? Explore our free list of these great stocks here.
NB: Figures in this article are calculated using data from the trailing twelve months from 30 June 2019. This may not be consistent with full year annual report figures.
We aim to bring you long-term focused research analysis driven by fundamental data. Note that our analysis may not factor in the latest price-sensitive company announcements or qualitative material.
If you spot an error that warrants correction, please contact the editor at editorial-team@simplywallst.com. This article by Simply Wall St is general in nature. It does not constitute a recommendation to buy or sell any stock, and does not take account of your objectives, or your financial situation. Simply Wall St has no position in the stocks mentioned. Thank you for reading.
