
 Yahoo Finance
 Does The Market Have A Low Tolerance For Computer Modelling Group Ltd.'s (TSE:CMG) Mixed Fundamentals?
It is hard to get excited after looking at Computer Modelling Group's (TSE:CMG) recent performance, when its stock has declined 12% over the past three months. It seems that the market might have completely ignored the positive aspects of the company's fundamentals and decided to weigh-in more on the negative aspects. Stock prices are usually driven by a company’s financial performance over the long term, and therefore we decided to pay more attention to the company's financial performance. In this article, we decided to focus on Computer Modelling Group's ROE.
Return on Equity or ROE is a test of how effectively a company is growing its value and managing investors’ money. In other words, it is a profitability ratio which measures the rate of return on the capital provided by the company's shareholders.
View our latest analysis for Computer Modelling Group
How To Calculate Return On Equity?
The formula for ROE is:
Return on Equity = Net Profit (from continuing operations) ÷ Shareholders' Equity
So, based on the above formula, the ROE for Computer Modelling Group is:
39% = CA$18m ÷ CA$47m (Based on the trailing twelve months to March 2022).
The 'return' is the yearly profit. Another way to think of that is that for every CA$1 worth of equity, the company was able to earn CA$0.39 in profit.
What Is The Relationship Between ROE And Earnings Growth?
Thus far, we have learned that ROE measures how efficiently a company is generating its profits. Depending on how much of these profits the company reinvests or "retains", and how effectively it does so, we are then able to assess a company’s earnings growth potential. Assuming all else is equal, companies that have both a higher return on equity and higher profit retention are usually the ones that have a higher growth rate when compared to companies that don't have the same features.
A Side By Side comparison of Computer Modelling Group's Earnings Growth And 39% ROE
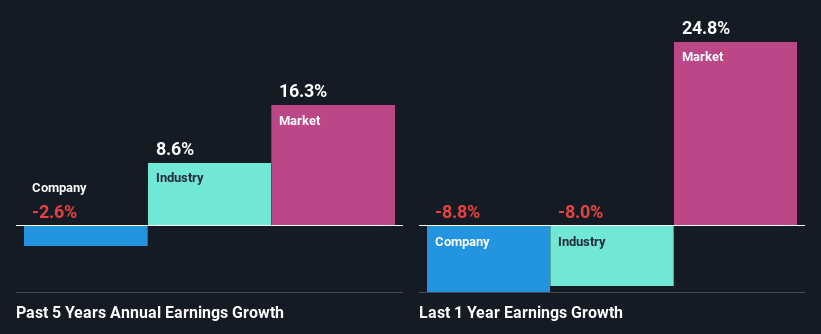
First thing first, we like that Computer Modelling Group has an impressive ROE. Secondly, even when compared to the industry average of 11% the company's ROE is quite impressive. For this reason, Computer Modelling Group's five year net income decline of 2.6% raises the question as to why the high ROE didn't translate into earnings growth. So, there might be some other aspects that could explain this. These include low earnings retention or poor allocation of capital.
That being said, we compared Computer Modelling Group's performance with the industry and were concerned when we found that while the company has shrunk its earnings, the industry has grown its earnings at a rate of 8.6% in the same period.
Earnings growth is an important metric to consider when valuing a stock. The investor should try to establish if the expected growth or decline in earnings, whichever the case may be, is priced in. Doing so will help them establish if the stock's future looks promising or ominous. What is CMG worth today? The intrinsic value infographic in our free research report helps visualize whether CMG is currently mispriced by the market.
Is Computer Modelling Group Using Its Retained Earnings Effectively?
Computer Modelling Group's very high three-year median payout ratio of 108% over the last three years suggests that the company is paying its shareholders more than what it is earning and this explains the company's shrinking earnings. Its usually very hard to sustain dividend payments that are higher than reported profits. To know the 2 risks we have identified for Computer Modelling Group visit our risks dashboard for free.
Additionally, Computer Modelling Group has paid dividends over a period of at least ten years, which means that the company's management is determined to pay dividends even if it means little to no earnings growth. Our latest analyst data shows that the future payout ratio of the company over the next three years is expected to be approximately 92%. As a result, Computer Modelling Group's ROE is not expected to change by much either, which we inferred from the analyst estimate of 37% for future ROE.
Conclusion
Overall, we have mixed feelings about Computer Modelling Group. Despite the high ROE, the company has a disappointing earnings growth number, due to its poor rate of reinvestment into its business. With that said, we studied the latest analyst forecasts and found that while the company has shrunk its earnings in the past, analysts expect its earnings to grow in the future. To know more about the company's future earnings growth forecasts take a look at this free report on analyst forecasts for the company to find out more.
Have feedback on this article? Concerned about the content? Get in touch with us directly. Alternatively, email editorial-team (at) simplywallst.com.
This article by Simply Wall St is general in nature. We provide commentary based on historical data and analyst forecasts only using an unbiased methodology and our articles are not intended to be financial advice. It does not constitute a recommendation to buy or sell any stock, and does not take account of your objectives, or your financial situation. We aim to bring you long-term focused analysis driven by fundamental data. Note that our analysis may not factor in the latest price-sensitive company announcements or qualitative material. Simply Wall St has no position in any stocks mentioned.
