
 Yahoo Finance
 How Does Investing In Firan Technology Group Corporation (TSE:FTG) Impact The Volatility Of Your Portfolio?

Want to participate in a short research study? Help shape the future of investing tools and you could win a $250 gift card!
Anyone researching Firan Technology Group Corporation (TSE:FTG) might want to consider the historical volatility of the share price. Modern finance theory considers volatility to be a measure of risk, and there are two main types of price volatility. First, we have company specific volatility, which is the price gyrations of an individual stock. Holding at least 8 stocks can reduce this kind of risk across a portfolio. The second type is the broader market volatility, which you cannot diversify away, since it arises from macroeconomic factors which directly affects all the stocks on the market.
Some stocks are more sensitive to general market forces than others. Beta is a widely used metric to measure a stock's exposure to market risk (volatility). Before we go on, it's worth noting that Warren Buffett pointed out in his 2014 letter to shareholders that 'volatility is far from synonymous with risk.' Having said that, beta can still be rather useful. The first thing to understand about beta is that the beta of the overall market is one. A stock with a beta below one is either less volatile than the market, or more volatile but not corellated with the overall market. In comparison a stock with a beta of over one tends to be move in a similar direction to the market in the long term, but with greater changes in price.
Check out our latest analysis for Firan Technology Group
What does FTG's beta value mean to investors?
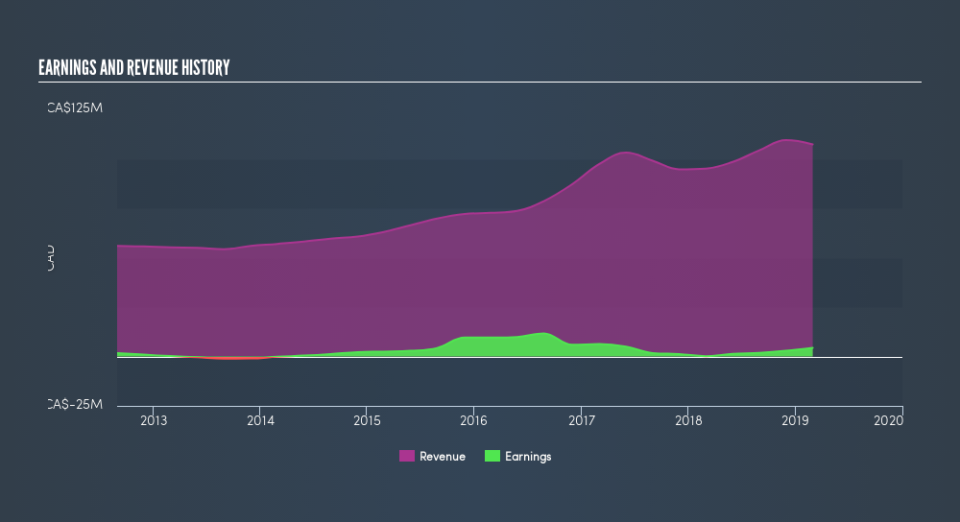
With a beta of 0.99, (which is quite close to 1) the share price of Firan Technology Group has historically been about as voltile as the broader market. Using history as a guide, we might surmise that the share price is likely to be influenced by market voltility going forward but it probably won't be particularly sensitive to it. Many would argue that beta is useful in position sizing, but fundamental metrics such as revenue and earnings are more important overall. You can see Firan Technology Group's revenue and earnings in the image below.
Could FTG's size cause it to be more volatile?
Firan Technology Group is a noticeably small company, with a market capitalisation of CA$75m. Most companies this size are not always actively traded. Companies this small are usually more volatile than the market, whether or not that volatility is correlated. Therefore, it's a bit surprising to see that this stock has a beta value so close to the overall market.
What this means for you:
It is probable that there is a link between the share price of Firan Technology Group and the broader market, since it has a beta value quite close to one. However, long term investors are generally well served by looking past market volatility and focussing on the underlying development of the business. If that's your game, metrics such as revenue, earnings and cash flow will be more useful. In order to fully understand whether FTG is a good investment for you, we also need to consider important company-specific fundamentals such as Firan Technology Group’s financial health and performance track record. I urge you to continue your research by taking a look at the following:
Future Outlook: What are well-informed industry analysts predicting for FTG’s future growth? Take a look at our free research report of analyst consensus for FTG’s outlook.
Past Track Record: Has FTG been consistently performing well irrespective of the ups and downs in the market? Go into more detail in the past performance analysis and take a look at the free visual representations of FTG's historicals for more clarity.
Other Interesting Stocks: It's worth checking to see how FTG measures up against other companies on valuation. You could start with this free list of prospective options.
We aim to bring you long-term focused research analysis driven by fundamental data. Note that our analysis may not factor in the latest price-sensitive company announcements or qualitative material.
If you spot an error that warrants correction, please contact the editor at editorial-team@simplywallst.com. This article by Simply Wall St is general in nature. It does not constitute a recommendation to buy or sell any stock, and does not take account of your objectives, or your financial situation. Simply Wall St has no position in the stocks mentioned. Thank you for reading.
