
 Yahoo Finance
 How Does Investing In Eastfield Resources Ltd. (CVE:ETF) Impact The Volatility Of Your Portfolio?

If you own shares in Eastfield Resources Ltd. (CVE:ETF) then it's worth thinking about how it contributes to the volatility of your portfolio, overall. In finance, Beta is a measure of volatility. Volatility is considered to be a measure of risk in modern finance theory. Investors may think of volatility as falling into two main categories. The first type is company specific volatility. Investors use diversification across uncorrelated stocks to reduce this kind of price volatility across the portfolio. The second sort is caused by the natural volatility of markets, overall. For example, certain macroeconomic events will impact (virtually) all stocks on the market.
Some stocks see their prices move in concert with the market. Others tend towards stronger, gentler or unrelated price movements. Beta is a widely used metric to measure a stock's exposure to market risk (volatility). Before we go on, it's worth noting that Warren Buffett pointed out in his 2014 letter to shareholders that 'volatility is far from synonymous with risk.' Having said that, beta can still be rather useful. The first thing to understand about beta is that the beta of the overall market is one. A stock with a beta greater than one is more sensitive to broader market movements than a stock with a beta of less than one.
Check out our latest analysis for Eastfield Resources
What we can learn from ETF's beta value
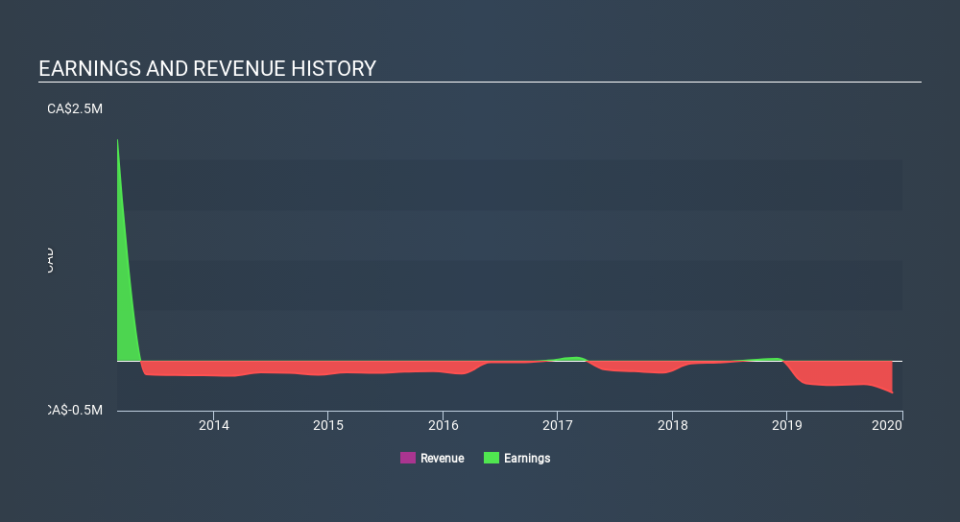
Looking at the last five years, Eastfield Resources has a beta of 1.71. The fact that this is well above 1 indicates that its share price movements have shown sensitivity to overall market volatility. Based on this history, investors should be aware that Eastfield Resources are likely to rise strongly in times of greed, but sell off in times of fear. Many would argue that beta is useful in position sizing, but fundamental metrics such as revenue and earnings are more important overall. You can see Eastfield Resources's revenue and earnings in the image below.
Could ETF's size cause it to be more volatile?
Eastfield Resources is a noticeably small company, with a market capitalisation of CA$1.6m. Most companies this size are not always actively traded. It has a relatively high beta, suggesting it is fairly actively traded for a company of its size. Because it takes less capital to move the share price of a small company like this, when a stock this size is actively traded it is quite often more sensitive to market volatility than similar large companies.
What this means for you:
Beta only tells us that the Eastfield Resources share price is sensitive to broader market movements. This could indicate that it is a high growth company, or is heavily influenced by sentiment because it is speculative. Alternatively, it could have operating leverage in its business model. Ultimately, beta is an interesting metric, but there's plenty more to learn. In order to fully understand whether ETF is a good investment for you, we also need to consider important company-specific fundamentals such as Eastfield Resources’s financial health and performance track record. I highly recommend you dive deeper by considering the following:
Past Track Record: Has ETF been consistently performing well irrespective of the ups and downs in the market? Go into more detail in the past performance analysis and take a look at the free visual representations of ETF's historicals for more clarity.
Other High-Performing Stocks: Are there other stocks that provide better prospects with proven track records? Explore our free list of these great stocks here.
If you spot an error that warrants correction, please contact the editor at editorial-team@simplywallst.com. This article by Simply Wall St is general in nature. It does not constitute a recommendation to buy or sell any stock, and does not take account of your objectives, or your financial situation. Simply Wall St has no position in the stocks mentioned.
We aim to bring you long-term focused research analysis driven by fundamental data. Note that our analysis may not factor in the latest price-sensitive company announcements or qualitative material. Thank you for reading.
