
 Yahoo Finance
 Does Hollysys Automation Technologies Ltd.’s (NASDAQ:HOLI) P/E Ratio Signal A Buying Opportunity?

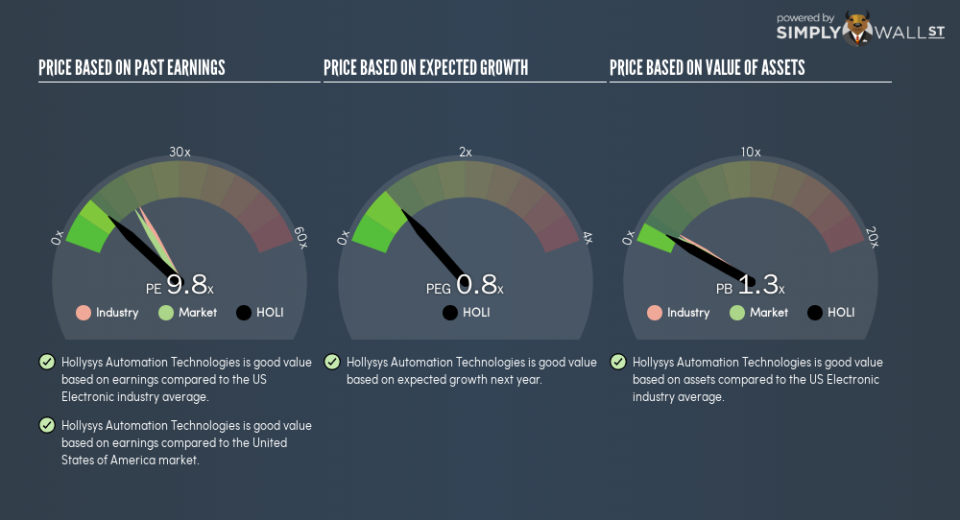
This article is for investors who would like to improve their understanding of price to earnings ratios (P/E ratios). We’ll look at Hollysys Automation Technologies Ltd.’s (NASDAQ:HOLI) P/E ratio and reflect on what it tells us about the company’s share price. Based on the last twelve months, Hollysys Automation Technologies’s P/E ratio is 9.79. That is equivalent to an earnings yield of about 10%.
Check out our latest analysis for Hollysys Automation Technologies
How Do I Calculate A Price To Earnings Ratio?
The formula for price to earnings is:
Price to Earnings Ratio = Share Price ÷ Earnings per Share (EPS)
Or for Hollysys Automation Technologies:
P/E of 9.79 = $18.41 ÷ $1.88 (Based on the year to September 2018.)
Is A High Price-to-Earnings Ratio Good?
A higher P/E ratio means that investors are paying a higher price for each $1 of company earnings. That is not a good or a bad thing per se, but a high P/E does imply buyers are optimistic about the future.
How Growth Rates Impact P/E Ratios
If earnings fall then in the future the ‘E’ will be lower. That means even if the current P/E is low, it will increase over time if the share price stays flat. A higher P/E should indicate the stock is expensive relative to others — and that may encourage shareholders to sell.
Hollysys Automation Technologies increased earnings per share by a whopping 65% last year. And its annual EPS growth rate over 5 years is 6.5%. So we’d generally expect it to have a relatively high P/E ratio. In contrast, EPS has decreased by 4.0%, annually, over 3 years.
How Does Hollysys Automation Technologies’s P/E Ratio Compare To Its Peers?
We can get an indication of market expectations by looking at the P/E ratio. We can see in the image below that the average P/E (18.2) for companies in the electronic industry is higher than Hollysys Automation Technologies’s P/E.
Hollysys Automation Technologies’s P/E tells us that market participants think it will not fare as well as its peers in the same industry. Many investors like to buy stocks when the market is pessimistic about their prospects. If you consider the stock interesting, further research is recommended. For example, I often monitor director buying and selling.
A Limitation: P/E Ratios Ignore Debt and Cash In The Bank
It’s important to note that the P/E ratio considers the market capitalization, not the enterprise value. That means it doesn’t take debt or cash into account. Theoretically, a business can improve its earnings (and produce a lower P/E in the future), by taking on debt (or spending its remaining cash).
Such expenditure might be good or bad, in the long term, but the point here is that the balance sheet is not reflected by this ratio.
How Does Hollysys Automation Technologies’s Debt Impact Its P/E Ratio?
Since Hollysys Automation Technologies holds net cash of US$402m, it can spend on growth, justifying a higher P/E ratio than otherwise.
The Verdict On Hollysys Automation Technologies’s P/E Ratio
Hollysys Automation Technologies’s P/E is 9.8 which is below average (16.7) in the US market. The net cash position gives plenty of options to the business, and the recent improvement in EPS is good to see. The relatively low P/E ratio implies the market is pessimistic. Because analysts are predicting more growth in the future, one might have expected to see a higher P/E ratio. You can taker closer look at the fundamentals, here.
Investors should be looking to buy stocks that the market is wrong about. If it is underestimating a company, investors can make money by buying and holding the shares until the market corrects itself. So this free visualization of the analyst consensus on future earnings could help you make the right decision about whether to buy, sell, or hold.
Of course, you might find a fantastic investment by looking at a few good candidates. So take a peek at this free list of companies with modest (or no) debt, trading on a P/E below 20.
To help readers see past the short term volatility of the financial market, we aim to bring you a long-term focused research analysis purely driven by fundamental data. Note that our analysis does not factor in the latest price-sensitive company announcements.
The author is an independent contributor and at the time of publication had no position in the stocks mentioned. For errors that warrant correction please contact the editor at editorial-team@simplywallst.com.
