
 Yahoo Finance
 Does Helmerich & Payne, Inc.'s (NYSE:HP) CEO Salary Reflect Performance?

In 2014 John Lindsay was appointed CEO of Helmerich & Payne, Inc. (NYSE:HP). First, this article will compare CEO compensation with compensation at similar sized companies. Then we'll look at a snap shot of the business growth. And finally we will reflect on how common stockholders have fared in the last few years, as a secondary measure of performance. This method should give us information to assess how appropriately the company pays the CEO.
View our latest analysis for Helmerich & Payne
How Does John Lindsay's Compensation Compare With Similar Sized Companies?
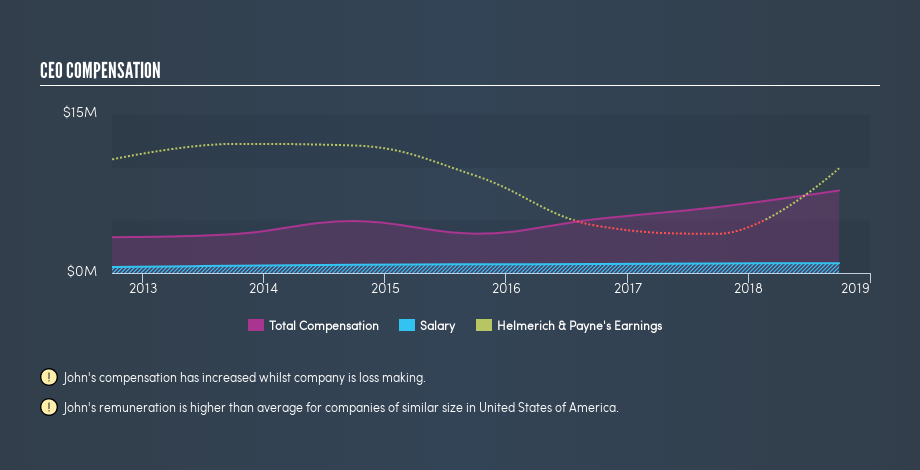
Our data indicates that Helmerich & Payne, Inc. is worth US$4.1b, and total annual CEO compensation is US$7.8m. (This number is for the twelve months until September 2018). We think total compensation is more important but we note that the CEO salary is lower, at US$928k. We looked at a group of companies with market capitalizations from US$2.0b to US$6.4b, and the median CEO total compensation was US$5.1m.
Thus we can conclude that John Lindsay receives more in total compensation than the median of a group of companies in the same market, and of similar size to Helmerich & Payne, Inc.. However, this doesn't necessarily mean the pay is too high. We can better assess whether the pay is overly generous by looking into the underlying business performance.
You can see, below, how CEO compensation at Helmerich & Payne has changed over time.
Is Helmerich & Payne, Inc. Growing?
Helmerich & Payne, Inc. has increased its earnings per share (EPS) by an average of 50% a year, over the last three years (using a line of best fit). Its revenue is up 23% over last year.
This shows that the company has improved itself over the last few years. Good news for shareholders. This sort of respectable year-on-year revenue growth is often seen at a healthy, growing business. You might want to check this free visual report on analyst forecasts for future earnings.
Has Helmerich & Payne, Inc. Been A Good Investment?
Since shareholders would have lost about 29% over three years, some Helmerich & Payne, Inc. shareholders would surely be feeling negative emotions. It therefore might be upsetting for shareholders if the CEO were paid generously.
In Summary...
We compared the total CEO remuneration paid by Helmerich & Payne, Inc., and compared it to remuneration at a group of similar sized companies. We found that it pays well over the median amount paid in the benchmark group.
However we must not forget that the EPS growth has been very strong over three years. Having said that, shareholders may be disappointed with the weak returns over the last three years. One might thus conclude that it would be better if the company waited until growth is reflected in the share price, before increasing CEO compensation. CEO compensation is one thing, but it is also interesting to check if the CEO is buying or selling Helmerich & Payne (free visualization of insider trades).
Arguably, business quality is much more important than CEO compensation levels. So check out this free list of interesting companies, that have HIGH return on equity and low debt.
We aim to bring you long-term focused research analysis driven by fundamental data. Note that our analysis may not factor in the latest price-sensitive company announcements or qualitative material.
If you spot an error that warrants correction, please contact the editor at editorial-team@simplywallst.com. This article by Simply Wall St is general in nature. It does not constitute a recommendation to buy or sell any stock, and does not take account of your objectives, or your financial situation. Simply Wall St has no position in the stocks mentioned. Thank you for reading.
