
 Yahoo Finance
 Does HealthEquity, Inc.'s (NASDAQ:HQY) CEO Pay Compare Well With Peers?

Jon Kessler has been the CEO of HealthEquity, Inc. (NASDAQ:HQY) since 2014. First, this article will compare CEO compensation with compensation at similar sized companies. Next, we'll consider growth that the business demonstrates. And finally - as a second measure of performance - we will look at the returns shareholders have received over the last few years. This method should give us information to assess how appropriately the company pays the CEO.
See our latest analysis for HealthEquity
How Does Jon Kessler's Compensation Compare With Similar Sized Companies?
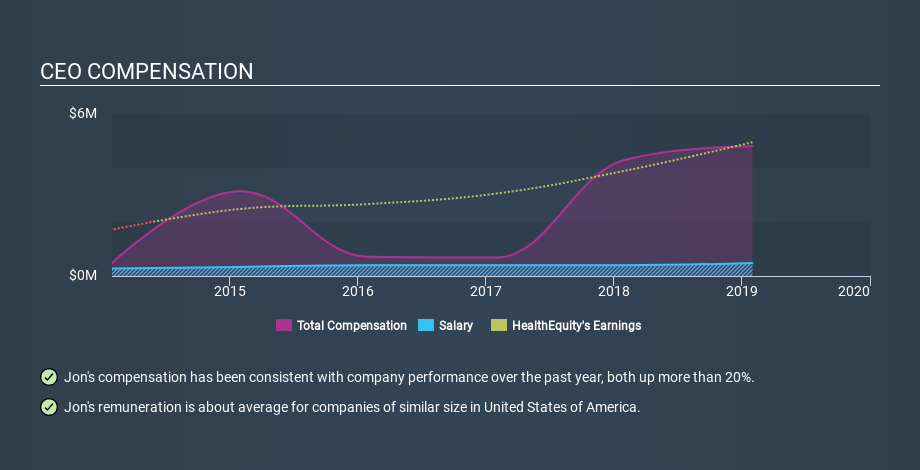
At the time of writing, our data says that HealthEquity, Inc. has a market cap of US$5.0b, and reported total annual CEO compensation of US$4.8m for the year to January 2019. While this analysis focuses on total compensation, it's worth noting the salary is lower, valued at US$483k. We further remind readers that the CEO may face performance requirements to receive the non-salary part of the total compensation. We examined companies with market caps from US$4.0b to US$12b, and discovered that the median CEO total compensation of that group was US$6.8m.
So Jon Kessler receives a similar amount to the median CEO pay, amongst the companies we looked at. While this data point isn't particularly informative alone, it gains more meaning when considered with business performance.
The graphic below shows how CEO compensation at HealthEquity has changed from year to year.
Is HealthEquity, Inc. Growing?
HealthEquity, Inc. has increased its earnings per share (EPS) by an average of 33% a year, over the last three years (using a line of best fit). In the last year, its revenue is up 50%.
This shows that the company has improved itself over the last few years. Good news for shareholders. Most shareholders would be pleased to see strong revenue growth combined with EPS growth. This combo suggests a fast growing business. You might want to check this free visual report on analyst forecasts for future earnings.
Has HealthEquity, Inc. Been A Good Investment?
Boasting a total shareholder return of 62% over three years, HealthEquity, Inc. has done well by shareholders. As a result, some may believe the CEO should be paid more than is normal for companies of similar size.
In Summary...
Remuneration for Jon Kessler is close enough to the median pay for a CEO of a similar sized company .
Shareholders would surely be happy to see that shareholder returns have been great, and the earnings per share are up. Although the pay is a normal amount, some shareholders probably consider it fair or modest, given the good performance of the stock. So you may want to check if insiders are buying HealthEquity shares with their own money (free access).
If you want to buy a stock that is better than HealthEquity, this free list of high return, low debt companies is a great place to look.
If you spot an error that warrants correction, please contact the editor at editorial-team@simplywallst.com. This article by Simply Wall St is general in nature. It does not constitute a recommendation to buy or sell any stock, and does not take account of your objectives, or your financial situation. Simply Wall St has no position in the stocks mentioned.
We aim to bring you long-term focused research analysis driven by fundamental data. Note that our analysis may not factor in the latest price-sensitive company announcements or qualitative material. Thank you for reading.
