
 Yahoo Finance
 What does Great Canadian Gaming Corporation’s (TSE:GC) Balance Sheet Tell Us About Its Future?

Want to participate in a short research study? Help shape the future of investing tools and receive a $20 prize!
Small-caps and large-caps are wildly popular among investors, however, mid-cap stocks, such as Great Canadian Gaming Corporation (TSE:GC), with a market capitalization of CA$3.1b, rarely draw their attention from the investing community. Despite this, the two other categories have lagged behind the risk-adjusted returns of commonly ignored mid-cap stocks. GC’s financial liquidity and debt position will be analysed in this article, to get an idea of whether the company can fund opportunities for strategic growth and maintain strength through economic downturns. Note that this information is centred entirely on financial health and is a top-level understanding, so I encourage you to look further into GC here.
View our latest analysis for Great Canadian Gaming
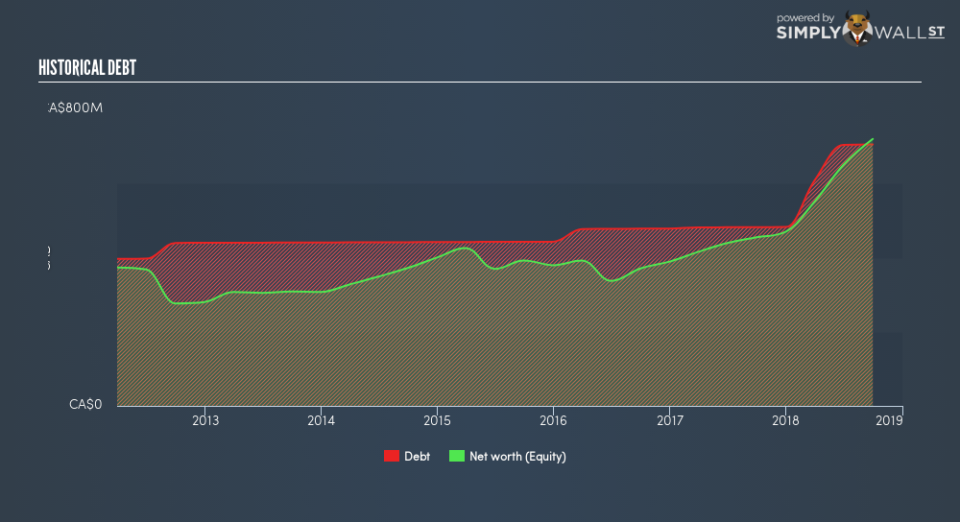
How much cash does GC generate through its operations?
Over the past year, GC has ramped up its debt from CA$482m to CA$706m – this includes long-term debt. With this increase in debt, GC’s cash and short-term investments stands at CA$580m , ready to deploy into the business. Moreover, GC has generated cash from operations of CA$357m during the same period of time, resulting in an operating cash to total debt ratio of 51%, signalling that GC’s debt is appropriately covered by operating cash. This ratio can also be a sign of operational efficiency as an alternative to return on assets. In GC’s case, it is able to generate 0.51x cash from its debt capital.
Can GC meet its short-term obligations with the cash in hand?
Looking at GC’s CA$227m in current liabilities, the company has maintained a safe level of current assets to meet its obligations, with the current ratio last standing at 3.02x. Having said that, a ratio above 3x may be considered excessive by some investors, yet this is not usually a major negative for a company.
Does GC face the risk of succumbing to its debt-load?
With a debt-to-equity ratio of 98%, GC can be considered as an above-average leveraged company. This is not unusual for mid-caps as debt tends to be a cheaper and faster source of funding for some businesses. We can check to see whether GC is able to meet its debt obligations by looking at the net interest coverage ratio. A company generating earnings before interest and tax (EBIT) at least three times its net interest payments is considered financially sound. In GC’s, case, the ratio of 7.56x suggests that interest is appropriately covered, which means that debtors may be willing to loan the company more money, giving GC ample headroom to grow its debt facilities.
Next Steps:
Although GC’s debt level is towards the higher end of the spectrum, its cash flow coverage seems adequate to meet obligations which means its debt is being efficiently utilised. Since there is also no concerns around GC’s liquidity needs, this may be its optimal capital structure for the time being. This is only a rough assessment of financial health, and I’m sure GC has company-specific issues impacting its capital structure decisions. You should continue to research Great Canadian Gaming to get a more holistic view of the mid-cap by looking at:
Future Outlook: What are well-informed industry analysts predicting for GC’s future growth? Take a look at our free research report of analyst consensus for GC’s outlook.
Valuation: What is GC worth today? Is the stock undervalued, even when its growth outlook is factored into its intrinsic value? The intrinsic value infographic in our free research report helps visualize whether GC is currently mispriced by the market.
Other High-Performing Stocks: Are there other stocks that provide better prospects with proven track records? Explore our free list of these great stocks here.
We aim to bring you long-term focused research analysis driven by fundamental data. Note that our analysis may not factor in the latest price-sensitive company announcements or qualitative material.
If you spot an error that warrants correction, please contact the editor at editorial-team@simplywallst.com. This article by Simply Wall St is general in nature. It does not constitute a recommendation to buy or sell any stock, and does not take account of your objectives, or your financial situation. Simply Wall St has no position in the stocks mentioned. On rare occasion, data errors may occur. Thank you for reading.
