
 Yahoo Finance
 What does Empire Industries Ltd’s (CVE:EIL) Balance Sheet Tell Us About Its Future?

Empire Industries Ltd (CVE:EIL) is a small-cap stock with a market capitalization of CA$40m. While investors primarily focus on the growth potential and competitive landscape of the small-cap companies, they end up ignoring a key aspect, which could be the biggest threat to its existence: its financial health. Why is it important? Since EIL is loss-making right now, it’s essential to understand the current state of its operations and pathway to profitability. Here are few basic financial health checks you should consider before taking the plunge. Nevertheless, given that I have not delve into the company-specifics, I suggest you dig deeper yourself into EIL here.
How does EIL’s operating cash flow stack up against its debt?
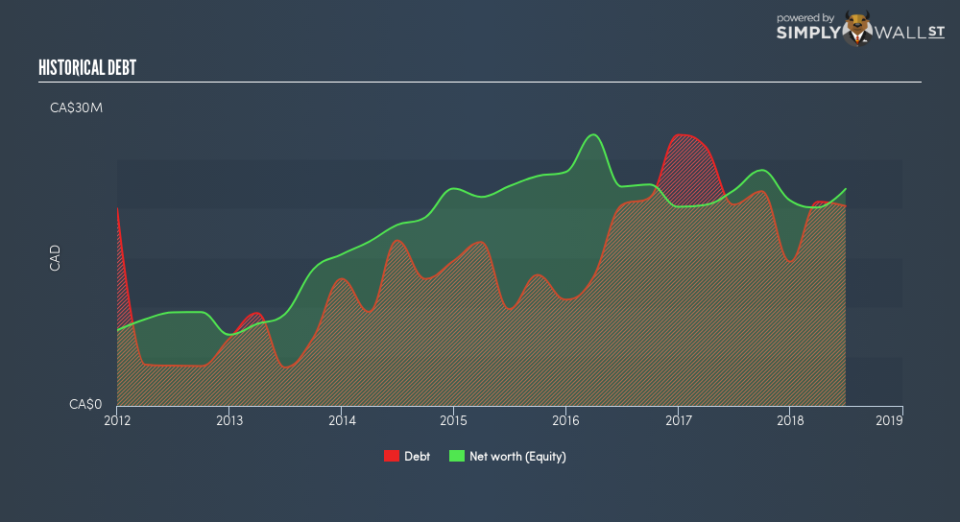
Over the past year, EIL has maintained its debt levels at around CA$20m comprising of short- and long-term debt. At this constant level of debt, EIL currently has CA$79k remaining in cash and short-term investments , ready to deploy into the business. Moving onto cash from operations, its operating cash flow is not yet significant enough to calculate a meaningful cash-to-debt ratio, indicating that operational efficiency is something we’d need to take a look at. As the purpose of this article is a high-level overview, I won’t be looking at this today, but you can take a look at some of EIL’s operating efficiency ratios such as ROA here.
Can EIL meet its short-term obligations with the cash in hand?
Looking at EIL’s most recent CA$58m liabilities, the company may not have an easy time meeting these commitments with a current assets level of CA$41m, leading to a current ratio of 0.72x.
Is EIL’s debt level acceptable?
EIL is a relatively highly levered company with a debt-to-equity of 92%. This is not unusual for small-caps as debt tends to be a cheaper and faster source of funding for some businesses. Though, since EIL is currently loss-making, sustainability of its current state of operations becomes a concern. Running high debt, while not yet making money, can be risky in unexpected downturns as liquidity may dry up, making it hard to operate.
Next Steps:
EIL’s high debt levels is not met with high cash flow coverage. This leaves room for improvement in terms of debt management and operational efficiency. In addition to this, its lack of liquidity raises questions over current asset management practices for the small-cap. Keep in mind I haven’t considered other factors such as how EIL has been performing in the past. You should continue to research Empire Industries to get a more holistic view of the stock by looking at:
Future Outlook: What are well-informed industry analysts predicting for EIL’s future growth? Take a look at our free research report of analyst consensus for EIL’s outlook.
Historical Performance: What has EIL’s returns been like over the past? Go into more detail in the past track record analysis and take a look at the free visual representations of our analysis for more clarity.
Other High-Performing Stocks: Are there other stocks that provide better prospects with proven track records? Explore our free list of these great stocks here.
To help readers see past the short term volatility of the financial market, we aim to bring you a long-term focused research analysis purely driven by fundamental data. Note that our analysis does not factor in the latest price-sensitive company announcements.
The author is an independent contributor and at the time of publication had no position in the stocks mentioned. For errors that warrant correction please contact the editor at editorial-team@simplywallst.com.
