
 Yahoo Finance
 What Does China Longyuan Power Group Corporation Limited’s (HKG:916) PE Ratio Tell You?

This article is intended for those of you who are at the beginning of your investing journey and want to start learning about core concepts of fundamental analysis on practical examples from today’s market.
China Longyuan Power Group Corporation Limited (HKG:916) trades with a trailing P/E of 10.2x, which is lower than the industry average of 11.6x. Although some investors may jump to the conclusion that this is a great buying opportunity, understanding the assumptions behind the P/E ratio might change your mind. In this article, I will deconstruct the P/E ratio and highlight what you need to be careful of when using the P/E ratio.
See our latest analysis for China Longyuan Power Group
Breaking down the Price-Earnings ratio
A common ratio used for relative valuation is the P/E ratio. It compares a stock’s price per share to the stock’s earnings per share. A more intuitive way of understanding the P/E ratio is to think of it as how much investors are paying for each dollar of the company’s earnings.
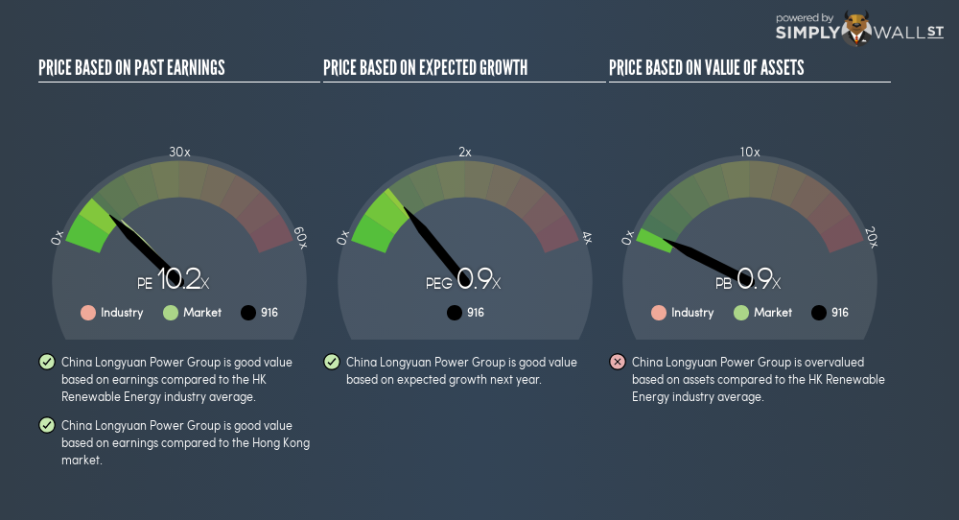
P/E Calculation for 916
Price-Earnings Ratio = Price per share ÷ Earnings per share
916 Price-Earnings Ratio = CN¥5.53 ÷ CN¥0.541 = 10.2x
The P/E ratio itself doesn’t tell you a lot; however, it becomes very insightful when you compare it with other similar companies. Our goal is to compare the stock’s P/E ratio to the average of companies that have similar attributes to 916, such as company lifetime and products sold. A quick method of creating a peer group is to use companies in the same industry, which is what I will do. Since 916’s P/E of 10.2 is lower than its industry peers (11.6), it means that investors are paying less for each dollar of 916’s earnings. This multiple is a median of profitable companies of 22 Renewable Energy companies in HK including Beijing Jingneng Clean Energy, Huadian Fuxin Energy and China Datang Renewable Power. You can think of it like this: the market is suggesting that 916 is a weaker business than the average comparable company.
Assumptions to watch out for
However, it is important to note that this conclusion is based on two key assumptions. The first is that our “similar companies” are actually similar to 916, or else the difference in P/E might be a result of other factors. For example, if you compared higher growth firms with 916, then its P/E would naturally be lower since investors would reward its peers’ higher growth with a higher price. The second assumption that must hold true is that the stocks we are comparing 916 to are fairly valued by the market. If this does not hold, there is a possibility that 916’s P/E is lower because our peer group is overvalued by the market.
What this means for you:
Since you may have already conducted your due diligence on 916, the undervaluation of the stock may mean it is a good time to top up on your current holdings. But at the end of the day, keep in mind that relative valuation relies heavily on critical assumptions I’ve outlined above. Remember that basing your investment decision off one metric alone is certainly not sufficient. There are many things I have not taken into account in this article and the PE ratio is very one-dimensional. If you have not done so already, I highly recommend you to complete your research by taking a look at the following:
Future Outlook: What are well-informed industry analysts predicting for 916’s future growth? Take a look at our free research report of analyst consensus for 916’s outlook.
Past Track Record: Has 916 been consistently performing well irrespective of the ups and downs in the market? Go into more detail in the past performance analysis and take a look at the free visual representations of 916’s historicals for more clarity.
Other High-Performing Stocks: Are there other stocks that provide better prospects with proven track records? Explore our free list of these great stocks here.
To help readers see past the short term volatility of the financial market, we aim to bring you a long-term focused research analysis purely driven by fundamental data. Note that our analysis does not factor in the latest price-sensitive company announcements.
The author is an independent contributor and at the time of publication had no position in the stocks mentioned. For errors that warrant correction please contact the editor at editorial-team@simplywallst.com.
