
 Yahoo Finance
 What Does China Gold International Resources Corp. Ltd.'s (TSE:CGG) Balance Sheet Tell Us About It?

Investors are always looking for growth in small-cap stocks like China Gold International Resources Corp. Ltd. (TSE:CGG), with a market cap of CA$626m. However, an important fact which most ignore is: how financially healthy is the business? Since CGG is loss-making right now, it’s crucial to assess the current state of its operations and pathway to profitability. The following basic checks can help you get a picture of the company's balance sheet strength. Nevertheless, potential investors would need to take a closer look, and I’d encourage you to dig deeper yourself into CGG here.
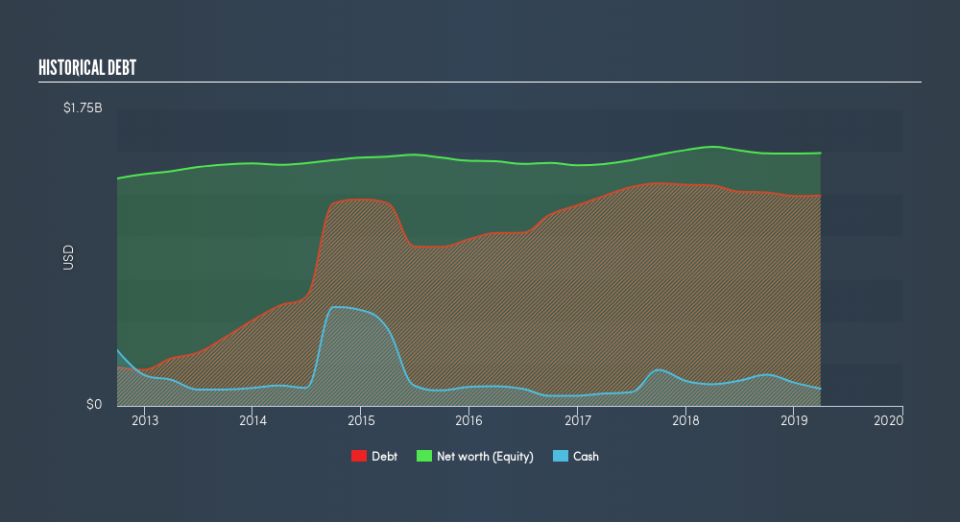
CGG’s Debt (And Cash Flows)
CGG has sustained its debt level by about US$1.2b over the last 12 months which accounts for long term debt. At this stable level of debt, the current cash and short-term investment levels stands at US$102m , ready to be used for running the business. Moreover, CGG has generated cash from operations of US$146m over the same time period, resulting in an operating cash to total debt ratio of 12%, meaning that CGG’s operating cash is less than its debt.
Does CGG’s liquid assets cover its short-term commitments?
At the current liabilities level of US$431m, it seems that the business has been able to meet these obligations given the level of current assets of US$431m, with a current ratio of 1x. The current ratio is the number you get when you divide current assets by current liabilities. Generally, for Metals and Mining companies, this is a reasonable ratio since there is a bit of a cash buffer without leaving too much capital in a low-return environment.
Is CGG’s debt level acceptable?
CGG is a relatively highly levered company with a debt-to-equity of 83%. This is somewhat unusual for small-caps companies, since lenders are often hesitant to provide attractive interest rates to less-established businesses. But since CGG is currently loss-making, there’s a question of sustainability of its current operations. Maintaining a high level of debt, while revenues are still below costs, can be dangerous as liquidity tends to dry up in unexpected downturns.
Next Steps:
CGG’s high cash coverage means that, although its debt levels are high, the company is able to utilise its borrowings efficiently in order to generate cash flow. Since there is also no concerns around CGG's liquidity needs, this may be its optimal capital structure for the time being. I admit this is a fairly basic analysis for CGG's financial health. Other important fundamentals need to be considered alongside. You should continue to research China Gold International Resources to get a more holistic view of the small-cap by looking at:
Future Outlook: What are well-informed industry analysts predicting for CGG’s future growth? Take a look at our free research report of analyst consensus for CGG’s outlook.
Valuation: What is CGG worth today? Is the stock undervalued, even when its growth outlook is factored into its intrinsic value? The intrinsic value infographic in our free research report helps visualize whether CGG is currently mispriced by the market.
Other High-Performing Stocks: Are there other stocks that provide better prospects with proven track records? Explore our free list of these great stocks here.
We aim to bring you long-term focused research analysis driven by fundamental data. Note that our analysis may not factor in the latest price-sensitive company announcements or qualitative material.
If you spot an error that warrants correction, please contact the editor at editorial-team@simplywallst.com. This article by Simply Wall St is general in nature. It does not constitute a recommendation to buy or sell any stock, and does not take account of your objectives, or your financial situation. Simply Wall St has no position in the stocks mentioned. Thank you for reading.
