How does Bitcoin’s hash rate impact price?
Recently, cryptocurrency enthusiasts on Twitter have been debating whether the Bitcoin block reward halving event has already been priced in by miners and investors and the impact of a high hash rate on BTC price.
When the halving event finally comes around in May, I see two major possibilities:
A) BTC increases in price in order to accommodate miners at the current mining difficulty.
B) BTC price stays more or less the same and we see miners capitulating as they become unprofitable.
To better understand which scenario is most likely to happen, I believe two key data points need to be taken into consideration – namely the hash rate (and expected hash rate) and the behaviour of hodlers.
Bitcoin’s hash rate has once again reached new all-time highs, but how does that relate to the amount of Bitcoins that haven’t moved?
Will Bitcoin hodlers keep holding during a bull market? At what percentage levels have miners and hodlers sold the majority of their positions? And does the hash rate predict price swings or the behaviour of hodlers?
Hopefully, I’ll be able to answer some of these questions below.
Hash rate hits new all-time highs
CM estimates have Bitcoin's Difficulty increasing by ~8% in 4 days time to reach a new ATH at ~15,000,000,000,000
This is due to the implied hash rate of Bitcoin maintaining ATH levels since Jan 1 pic.twitter.com/MfLOKTJNiK
— CoinMetrics.io (@coinmetrics) January 10, 2020
As Bitcoin’s hash rate increases, mining difficulty also increases. That’s exactly what’s been happening with Bitcoin since the beginning of 2020.
As estimated by CoinMetrics, a research firm specialising in the cryptocurrency market, Bitcoin’s mining difficulty has been steadily increasing at a rate of 8% over the last four days.
The analysis conducted by CoinMetrics shows that in the next four days, Bitcoin’s mining difficulty will reach a record value of approximately 15,000,000,000,000 TH/s.
Just as the hash rate is a good measure for price prediction, the difficulty adjustment is also an important data point. Some believe it has some correlation with cryptocurrency price drops and spikes as miners enter and leave the market.
The Bitcoin difficulty target adjusts every two weeks to ensure that blocks are added at regular intervals. Therefore, this data point is closely linked to the profit of the miners.
Consequently, the link extends to miner capitulation and the general market price as well. As such, it seems there is a direct correlation between the difficulty adjustment and Bitcoin rallies.
At what point do miners sell?
Rien ne va plus#bitcoin 🚀 pic.twitter.com/epwODQ40cm
— PlanB (@100trillionUSD) September 10, 2019
One of my favourite crypto analysts and the creator of the Bitcoin stock-to-flow model, PlanB, suggested the price of Bitcoin has a tendency to rally during mining difficulty downturns.
The analyst revealed that since the creation of Bitcoin, there have been several cycles of difficulty adjustments, and for each new rally, the trend has been one of a declining magnitude.
Therefore, I personally believe that during the next bull run, we could see miners and hodlers selling a great deal of their positions when Bitcoin’s price hits between 1,000% to 5,000% above the difficulty bottom.
If you’re wondering about “when”, historically we have two periods of price appreciation and two periods of price downfall. Since 2018 and 2019 have been declining years compared to all-time highs, I believe Bitcoin will pump over 2020 and 2021.
At what point do hodlers sell?

Interestingly, for Bitcoin’s price to skyrocket, hodlers need to sell.
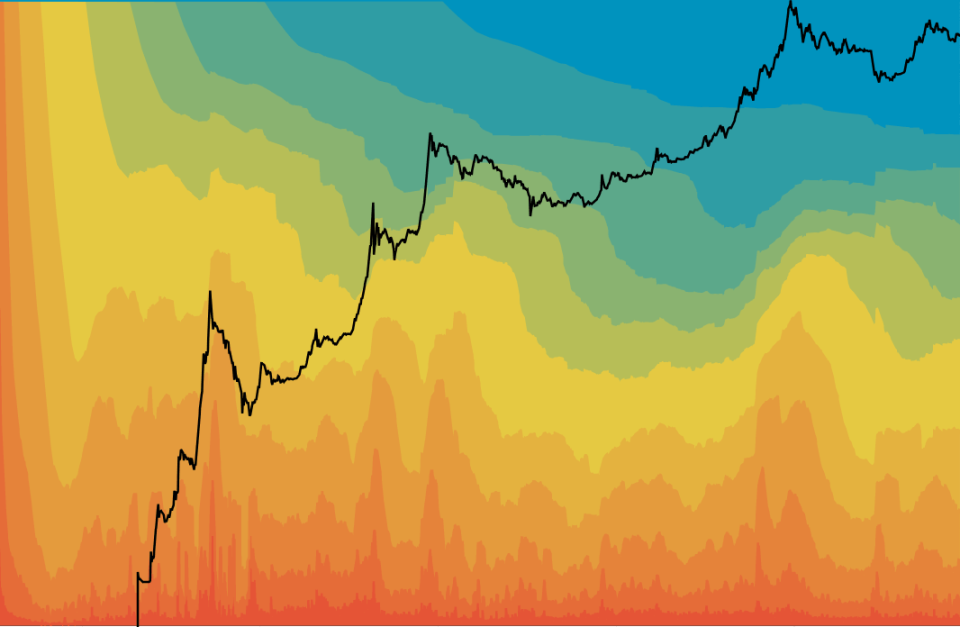
The graph above, courtesy of Unchained Capital, shows the unspent transaction output (UTXO) of Bitcoin over time.
The data shows that during moments of price appreciation, long-term Bitcoin hodlers have a tendency to sell. However, during periods of price decline, long-term hodlers buy BTC.
The red, yellow, and orange bands represent the amount of BTC being exchanged. The green and blue bands show the amount of BTC that hasn’t moved for up to five years or more.
As you can see, the blue band has been consistently increasing and now accounts for close to 25% of the total BTC supply. This means a great deal of hodlers have been increasing their stacks.
While there was some sell-off pressure (the yellow and orange bands) during 2019, it seems buyers are now back in control.
To conclude, what the above data shows is crucial to understand when price will most likely appreciate.
In my opinion, only when we start to see the blue and green bands increasing between 10-20% will a proper bull run begin. When will that happen? Probably between the end of 2020 and start of 2021.
Until the halving, I expect long-term hodlers to continue to accumulate as miners sell their coins to keep farms profitable.
Safe trades.
The post How does Bitcoin’s hash rate impact price? appeared first on Coin Rivet.

 Yahoo Finance