
 Yahoo Finance
 How Does B2Gold's (TSE:BTO) P/E Compare To Its Industry, After The Share Price Drop?

Unfortunately for some shareholders, the B2Gold (TSE:BTO) share price has dived 33% in the last thirty days. Looking back further, the stock is up 4.7% in the last year.
All else being equal, a share price drop should make a stock more attractive to potential investors. While the market sentiment towards a stock is very changeable, in the long run, the share price will tend to move in the same direction as earnings per share. The implication here is that long term investors have an opportunity when expectations of a company are too low. Perhaps the simplest way to get a read on investors' expectations of a business is to look at its Price to Earnings Ratio (PE Ratio). A high P/E ratio means that investors have a high expectation about future growth, while a low P/E ratio means they have low expectations about future growth.
Check out our latest analysis for B2Gold
Does B2Gold Have A Relatively High Or Low P/E For Its Industry?
B2Gold's P/E is 9.78. You can see in the image below that the average P/E (9.5) for companies in the metals and mining industry is roughly the same as B2Gold's P/E.
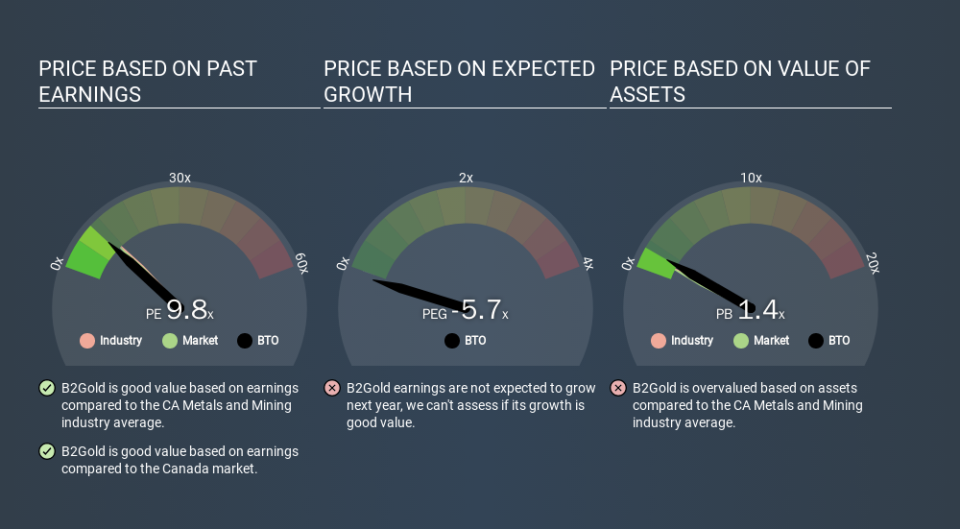
Its P/E ratio suggests that B2Gold shareholders think that in the future it will perform about the same as other companies in its industry classification. The company could surprise by performing better than average, in the future. Checking factors such as director buying and selling. could help you form your own view on if that will happen.
How Growth Rates Impact P/E Ratios
Earnings growth rates have a big influence on P/E ratios. When earnings grow, the 'E' increases, over time. And in that case, the P/E ratio itself will drop rather quickly. So while a stock may look expensive based on past earnings, it could be cheap based on future earnings.
B2Gold's 135% EPS improvement over the last year was like bamboo growth after rain; rapid and impressive. And earnings per share have improved by 89% annually, over the last three years. So you might say it really deserves to have an above-average P/E ratio.
A Limitation: P/E Ratios Ignore Debt and Cash In The Bank
The 'Price' in P/E reflects the market capitalization of the company. Thus, the metric does not reflect cash or debt held by the company. In theory, a company can lower its future P/E ratio by using cash or debt to invest in growth.
While growth expenditure doesn't always pay off, the point is that it is a good option to have; but one that the P/E ratio ignores.
B2Gold's Balance Sheet
B2Gold has net debt worth just 3.9% of its market capitalization. So it doesn't have as many options as it would with net cash, but its debt would not have much of an impact on its P/E ratio.
The Bottom Line On B2Gold's P/E Ratio
B2Gold has a P/E of 9.8. That's around the same as the average in the CA market, which is 9.9. With only modest debt levels, and strong earnings growth, the market seems to doubt that the growth can be maintained. Because analysts are predicting more growth in the future, one might have expected to see a higher P/E ratio. You can take a closer look at the fundamentals, here. Given B2Gold's P/E ratio has declined from 14.5 to 9.8 in the last month, we know for sure that the market is more worried about the business today, than it was back then. For those who prefer to invest with the flow of momentum, that might be a bad sign, but for deep value investors this stock might justify some research.
Investors have an opportunity when market expectations about a stock are wrong. As value investor Benjamin Graham famously said, 'In the short run, the market is a voting machine but in the long run, it is a weighing machine. So this free visualization of the analyst consensus on future earnings could help you make the right decision about whether to buy, sell, or hold.
Of course you might be able to find a better stock than B2Gold. So you may wish to see this free collection of other companies that have grown earnings strongly.
If you spot an error that warrants correction, please contact the editor at editorial-team@simplywallst.com. This article by Simply Wall St is general in nature. It does not constitute a recommendation to buy or sell any stock, and does not take account of your objectives, or your financial situation. Simply Wall St has no position in the stocks mentioned.
We aim to bring you long-term focused research analysis driven by fundamental data. Note that our analysis may not factor in the latest price-sensitive company announcements or qualitative material. Thank you for reading.
