
 Yahoo Finance
 Does Astronics Corporation (NASDAQ:ATRO) Have A Good P/E Ratio?

Today, we'll introduce the concept of the P/E ratio for those who are learning about investing. We'll look at Astronics Corporation's (NASDAQ:ATRO) P/E ratio and reflect on what it tells us about the company's share price. Based on the last twelve months, Astronics's P/E ratio is 9.29. That is equivalent to an earnings yield of about 10.8%.
Check out our latest analysis for Astronics
How Do You Calculate A P/E Ratio?
The formula for price to earnings is:
Price to Earnings Ratio = Share Price ÷ Earnings per Share (EPS)
Or for Astronics:
P/E of 9.29 = $28.22 ÷ $3.04 (Based on the year to September 2019.)
Is A High Price-to-Earnings Ratio Good?
A higher P/E ratio means that investors are paying a higher price for each $1 of company earnings. That isn't necessarily good or bad, but a high P/E implies relatively high expectations of what a company can achieve in the future.
How Does Astronics's P/E Ratio Compare To Its Peers?
One good way to get a quick read on what market participants expect of a company is to look at its P/E ratio. We can see in the image below that the average P/E (20.2) for companies in the aerospace & defense industry is higher than Astronics's P/E.
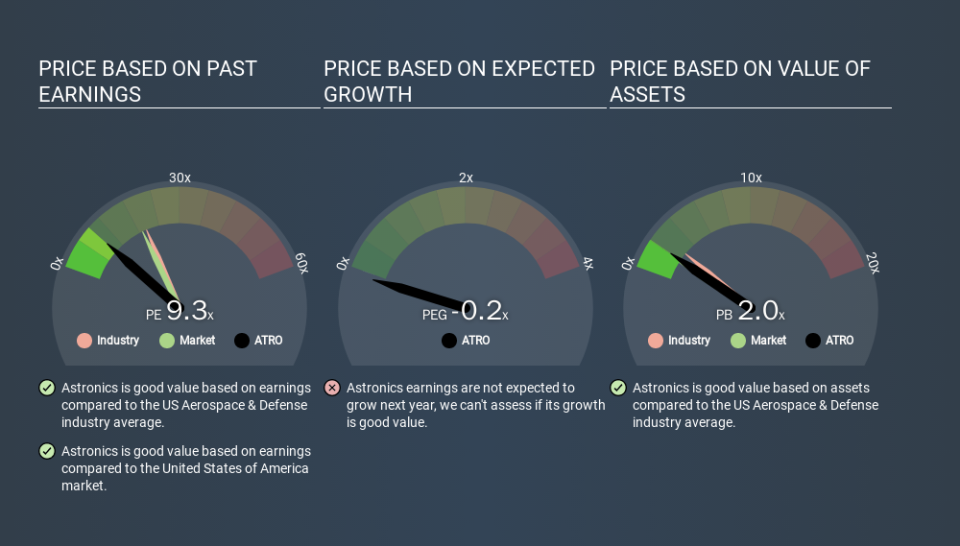
Its relatively low P/E ratio indicates that Astronics shareholders think it will struggle to do as well as other companies in its industry classification. While current expectations are low, the stock could be undervalued if the situation is better than the market assumes. You should delve deeper. I like to check if company insiders have been buying or selling.
How Growth Rates Impact P/E Ratios
Generally speaking the rate of earnings growth has a profound impact on a company's P/E multiple. When earnings grow, the 'E' increases, over time. That means unless the share price increases, the P/E will reduce in a few years. So while a stock may look expensive based on past earnings, it could be cheap based on future earnings.
In the last year, Astronics grew EPS like Taylor Swift grew her fan base back in 2010; the 244% gain was both fast and well deserved. The sweetener is that the annual five year growth rate of 18% is also impressive. With that kind of growth rate we would generally expect a high P/E ratio.
A Limitation: P/E Ratios Ignore Debt and Cash In The Bank
The 'Price' in P/E reflects the market capitalization of the company. That means it doesn't take debt or cash into account. Hypothetically, a company could reduce its future P/E ratio by spending its cash (or taking on debt) to achieve higher earnings.
Such spending might be good or bad, overall, but the key point here is that you need to look at debt to understand the P/E ratio in context.
So What Does Astronics's Balance Sheet Tell Us?
Astronics's net debt is 18% of its market cap. That's enough debt to impact the P/E ratio a little; so keep it in mind if you're comparing it to companies without debt.
The Verdict On Astronics's P/E Ratio
Astronics has a P/E of 9.3. That's below the average in the US market, which is 18.9. The EPS growth last year was strong, and debt levels are quite reasonable. If it continues to grow, then the current low P/E may prove to be unjustified.
When the market is wrong about a stock, it gives savvy investors an opportunity. As value investor Benjamin Graham famously said, 'In the short run, the market is a voting machine but in the long run, it is a weighing machine. So this free visualization of the analyst consensus on future earnings could help you make the right decision about whether to buy, sell, or hold.
You might be able to find a better buy than Astronics. If you want a selection of possible winners, check out this free list of interesting companies that trade on a P/E below 20 (but have proven they can grow earnings).
If you spot an error that warrants correction, please contact the editor at editorial-team@simplywallst.com. This article by Simply Wall St is general in nature. It does not constitute a recommendation to buy or sell any stock, and does not take account of your objectives, or your financial situation. Simply Wall St has no position in the stocks mentioned.
We aim to bring you long-term focused research analysis driven by fundamental data. Note that our analysis may not factor in the latest price-sensitive company announcements or qualitative material. Thank you for reading.
