
 Yahoo Finance
 Does Algonquin Power & Utilities Corp’s (TSE:AQN) Past Performance Indicate A Stronger Future?

Examining Algonquin Power & Utilities Corp’s (TSE:AQN) past track record of performance is an insightful exercise for investors. It allows us to reflect on whether or not the company has met or exceed expectations, which is a great indicator for future performance. Today I will assess AQN’s latest performance announced on 30 June 2018 and compare these figures to its longer term trend and industry movements.
View our latest analysis for Algonquin Power & Utilities
Did AQN’s recent earnings growth beat the long-term trend and the industry?
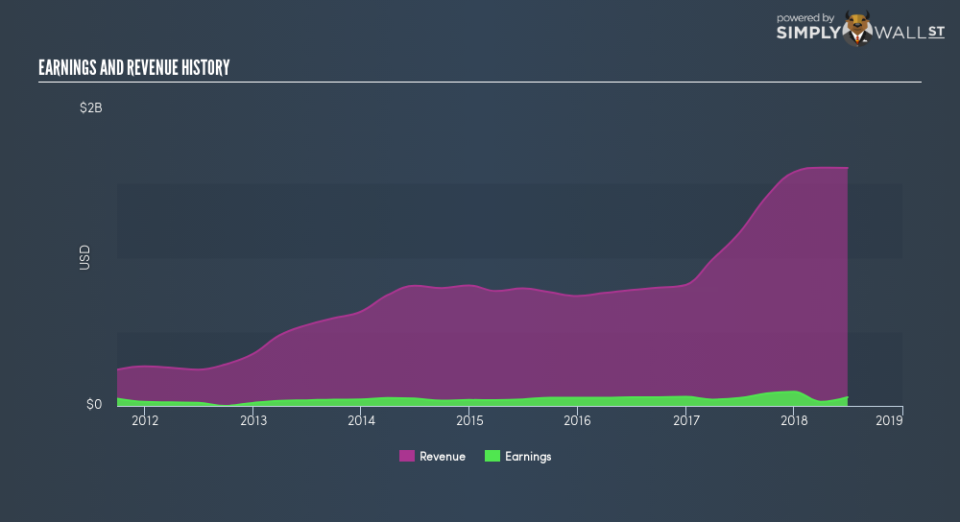
AQN’s trailing twelve-month earnings (from 30 June 2018) of US$58.6m has jumped 11.0% compared to the previous year. However, this one-year growth rate has been lower than its average earnings growth rate over the past 5 years of 13.7%, indicating the rate at which AQN is growing has slowed down. Why could this be happening? Well, let’s examine what’s going on with margins and if the rest of the industry is feeling the heat.
Revenue growth in the last few years, has been positive, however, earnings growth has fallen behind meaning Algonquin Power & Utilities has been growing its expenses by a lot more. This hurts margins and earnings, and is not a sustainable practice. Scanning growth from a sector-level, the Canadian integrated utilities industry has been growing its average earnings by double-digit 10.6% over the past twelve months, and a less exciting 6.8% over the past five. Since the Integrated Utilities sector in CA is relatively small, I’ve included similar companies in the wider region in order to get a better idea of the growth, which is a median of profitable companies of companies such as ATCO, Canadian Utilities and Just Energy Group. This means whatever tailwind the industry is benefiting from, Algonquin Power & Utilities is able to leverage this to its advantage.
In terms of returns from investment, Algonquin Power & Utilities has fallen short of achieving a 20% return on equity (ROE), recording 1.8% instead. Furthermore, its return on assets (ROA) of 2.0% is below the CA Integrated Utilities industry of 4.5%, indicating Algonquin Power & Utilities’s are utilized less efficiently. However, its return on capital (ROC), which also accounts for Algonquin Power & Utilities’s debt level, has increased over the past 3 years from 2.5% to 3.0%.
What does this mean?
Algonquin Power & Utilities’s track record can be a valuable insight into its earnings performance, but it certainly doesn’t tell the whole story. Companies that have performed well in the past, such as Algonquin Power & Utilities gives investors conviction. However, the next step would be to assess whether the future looks as optimistic. You should continue to research Algonquin Power & Utilities to get a more holistic view of the stock by looking at:
Future Outlook: What are well-informed industry analysts predicting for AQN’s future growth? Take a look at our free research report of analyst consensus for AQN’s outlook.
Financial Health: Are AQN’s operations financially sustainable? Balance sheets can be hard to analyze, which is why we’ve done it for you. Check out our financial health checks here.
Other High-Performing Stocks: Are there other stocks that provide better prospects with proven track records? Explore our free list of these great stocks here.
NB: Figures in this article are calculated using data from the trailing twelve months from 30 June 2018. This may not be consistent with full year annual report figures.
To help readers see past the short term volatility of the financial market, we aim to bring you a long-term focused research analysis purely driven by fundamental data. Note that our analysis does not factor in the latest price-sensitive company announcements.
The author is an independent contributor and at the time of publication had no position in the stocks mentioned. For errors that warrant correction please contact the editor at editorial-team@simplywallst.com.
