
 Yahoo Finance
 Does Air Canada's (TSE:AC) P/E Ratio Signal A Buying Opportunity?

Want to participate in a short research study? Help shape the future of investing tools and you could win a $250 gift card!
The goal of this article is to teach you how to use price to earnings ratios (P/E ratios). To keep it practical, we'll show how Air Canada's (TSE:AC) P/E ratio could help you assess the value on offer. Air Canada has a price to earnings ratio of 15.15, based on the last twelve months. That corresponds to an earnings yield of approximately 6.6%.
See our latest analysis for Air Canada
How Do You Calculate Air Canada's P/E Ratio?
The formula for price to earnings is:
Price to Earnings Ratio = Share Price ÷ Earnings per Share (EPS)
Or for Air Canada:
P/E of 15.15 = CA$39.9 ÷ CA$2.63 (Based on the trailing twelve months to March 2019.)
Is A High P/E Ratio Good?
A higher P/E ratio implies that investors pay a higher price for the earning power of the business. That is not a good or a bad thing per se, but a high P/E does imply buyers are optimistic about the future.
How Growth Rates Impact P/E Ratios
Probably the most important factor in determining what P/E a company trades on is the earnings growth. When earnings grow, the 'E' increases, over time. And in that case, the P/E ratio itself will drop rather quickly. A lower P/E should indicate the stock is cheap relative to others -- and that may attract buyers.
Air Canada saw earnings per share decrease by 61% last year. But it has grown its earnings per share by 1.5% per year over the last three years.
Does Air Canada Have A Relatively High Or Low P/E For Its Industry?
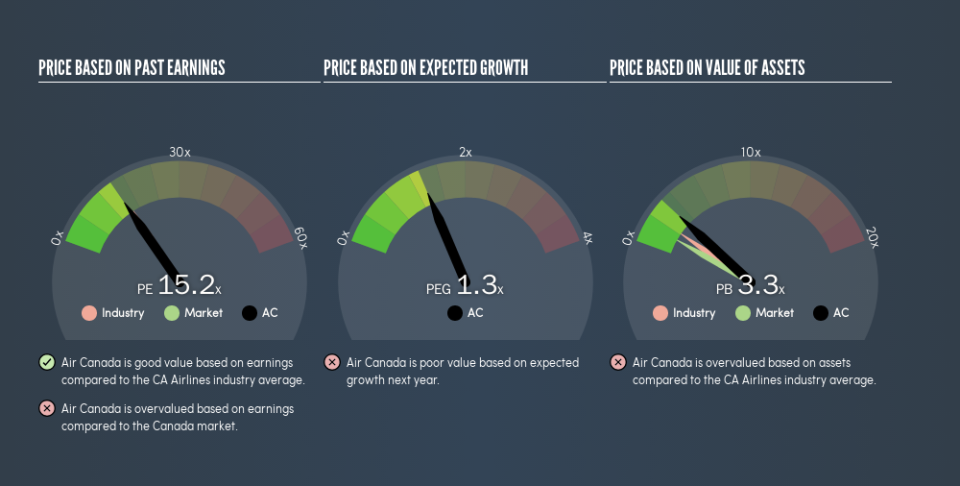
One good way to get a quick read on what market participants expect of a company is to look at its P/E ratio. The image below shows that Air Canada has a P/E ratio that is roughly in line with the airlines industry average (15.8).
Its P/E ratio suggests that Air Canada shareholders think that in the future it will perform about the same as other companies in its industry classification. So if Air Canada actually outperforms its peers going forward, that should be a positive for the share price. Checking factors such as the tenure of the board and management could help you form your own view on if that will happen.
A Limitation: P/E Ratios Ignore Debt and Cash In The Bank
The 'Price' in P/E reflects the market capitalization of the company. In other words, it does not consider any debt or cash that the company may have on the balance sheet. Hypothetically, a company could reduce its future P/E ratio by spending its cash (or taking on debt) to achieve higher earnings.
While growth expenditure doesn't always pay off, the point is that it is a good option to have; but one that the P/E ratio ignores.
Is Debt Impacting Air Canada's P/E?
Air Canada's net debt equates to 36% of its market capitalization. While it's worth keeping this in mind, it isn't a worry.
The Verdict On Air Canada's P/E Ratio
Air Canada has a P/E of 15.2. That's around the same as the average in the CA market, which is 14.8. With modest debt, and a lack of recent growth, it would seem the market is expecting improvement in earnings.
Investors should be looking to buy stocks that the market is wrong about. If the reality for a company is better than it expects, you can make money by buying and holding for the long term. So this free visualization of the analyst consensus on future earnings could help you make the right decision about whether to buy, sell, or hold.
Of course, you might find a fantastic investment by looking at a few good candidates. So take a peek at this free list of companies with modest (or no) debt, trading on a P/E below 20.
We aim to bring you long-term focused research analysis driven by fundamental data. Note that our analysis may not factor in the latest price-sensitive company announcements or qualitative material.
If you spot an error that warrants correction, please contact the editor at editorial-team@simplywallst.com. This article by Simply Wall St is general in nature. It does not constitute a recommendation to buy or sell any stock, and does not take account of your objectives, or your financial situation. Simply Wall St has no position in the stocks mentioned. Thank you for reading.
