
 Yahoo Finance
 Diversified Royalty Corp (TSE:DIV): Time For A Financial Health Check

While small-cap stocks, such as Diversified Royalty Corp (TSE:DIV) with its market cap of CA$344.7m, are popular for their explosive growth, investors should also be aware of their balance sheet to judge whether the company can survive a downturn. Evaluating financial health as part of your investment thesis is crucial, since poor capital management may bring about bankruptcies, which occur at a higher rate for small-caps. Here are a few basic checks that are good enough to have a broad overview of the company’s financial strength. Nevertheless, this commentary is still very high-level, so I’d encourage you to dig deeper yourself into DIV here.
How does DIV’s operating cash flow stack up against its debt?
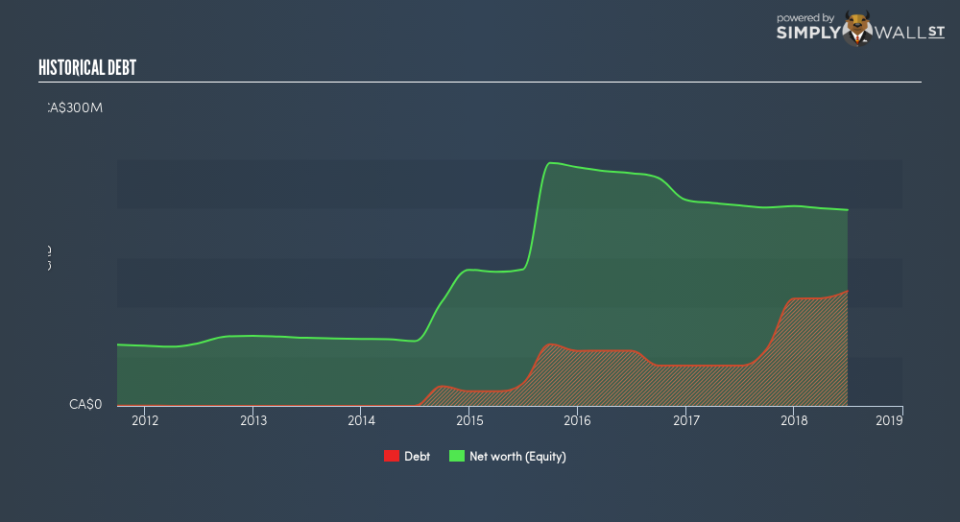
DIV’s debt levels surged from CA$40.7m to CA$116.1m over the last 12 months , which is made up of current and long term debt. With this growth in debt, DIV currently has CA$81.1m remaining in cash and short-term investments for investing into the business. Moreover, DIV has produced cash from operations of CA$16.3m over the same time period, leading to an operating cash to total debt ratio of 14.1%, signalling that DIV’s current level of operating cash is not high enough to cover debt. This ratio can also be interpreted as a measure of efficiency as an alternative to return on assets. In DIV’s case, it is able to generate 0.14x cash from its debt capital.
Can DIV meet its short-term obligations with the cash in hand?
With current liabilities at CA$780.0k, it seems that the business has maintained a safe level of current assets to meet its obligations, with the current ratio last standing at 109x. Though, a ratio greater than 3x may be considered as too high, as DIV could be holding too much capital in a low-return investment environment.
Is DIV’s debt level acceptable?
DIV is a relatively highly levered company with a debt-to-equity of 58.5%. This is not unusual for small-caps as debt tends to be a cheaper and faster source of funding for some businesses. We can test if DIV’s debt levels are sustainable by measuring interest payments against earnings of a company. Ideally, earnings before interest and tax (EBIT) should cover net interest by at least three times. For DIV, the ratio of 6.29x suggests that interest is appropriately covered, which means that debtors may be willing to loan the company more money, giving DIV ample headroom to grow its debt facilities.
Next Steps:
At its current level of cash flow coverage, DIV has room for improvement to better cushion for events which may require debt repayment. However, the company exhibits proper management of current assets and upcoming liabilities. Keep in mind I haven’t considered other factors such as how DIV has been performing in the past. You should continue to research Diversified Royalty to get a more holistic view of the stock by looking at:
Future Outlook: What are well-informed industry analysts predicting for DIV’s future growth? Take a look at our free research report of analyst consensus for DIV’s outlook.
Valuation: What is DIV worth today? Is the stock undervalued, even when its growth outlook is factored into its intrinsic value? The intrinsic value infographic in our free research report helps visualize whether DIV is currently mispriced by the market.
Other High-Performing Stocks: Are there other stocks that provide better prospects with proven track records? Explore our free list of these great stocks here.
To help readers see past the short term volatility of the financial market, we aim to bring you a long-term focused research analysis purely driven by fundamental data. Note that our analysis does not factor in the latest price-sensitive company announcements.
The author is an independent contributor and at the time of publication had no position in the stocks mentioned. For errors that warrant correction please contact the editor at editorial-team@simplywallst.com.
