
 Yahoo Finance
 Discovery Silver Reports Preliminary Economic Assessment on Cordero with After-Tax NPV of US$1.2 B, IRR of 38% and Payback of 2.0 Years
Figure 1
After-Tax Free Cash Flow
Figure 2

LOM Production & AISC
Figure 3
APPENDIX D - LOM MINE PLAN SUMMARY
Figure 4
APPENDIX E - LOM PROCESS THROUGHPUT SUMMARY
Figure 5
PHASE 1
Figure 6
PHASE 2
Figure 7
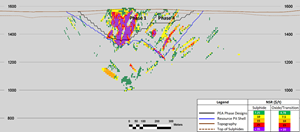
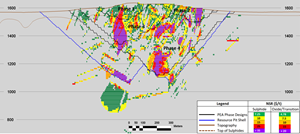
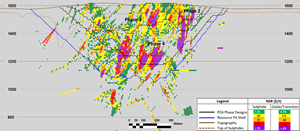
APPENDIX H - LONG SECTIONS / CROSS SECTIONS
Figure 8
LONG SECTION A-A’ (looking NW)
Figure 9
LONG SECTION B-B’ (looking NW)
Figure 10
CROSS SECTION C-C’ (looking NE)
Figure 11
CROSS SECTION D-D’ (looking NE)
Figure 12
CROSS SECTION E-E’ (looking NE)
Figure 13
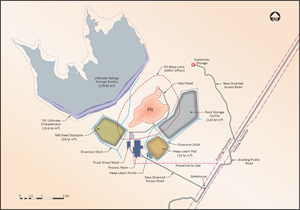
APPENDIX I - SITE LAYOUT
TORONTO, Nov. 30, 2021 (GLOBE NEWSWIRE) -- Discovery Silver Corp. (TSX-V: DSV, OTCQX: DSVSF) (“Discovery” or the “Company”) is pleased to announce results from its Preliminary Economic Assessment (“PEA” or “the Study”) on its 100%-owned Cordero silver project (“Cordero” or “the Project”) located in Chihuahua State, Mexico.
Study highlights include (all figures are in USD unless otherwise noted):
Excellent project economics: Base Case after-tax NPV5% of $1.2 B (C$1.5 B) and IRR of 38% (Ag - $22.00/oz, Au - $1,600/oz, Pb - $1.00/lb and Zn - $1.20/lb).
Exceptional silver price leverage: Upside Case after-tax NPV5% of $1.9 B (C$2.4 B) and IRR of 55% (Ag - $27.50/oz, Au - $1,880/oz, Pb - $1.10/lb and Zn - $1.45/lb based on one-year trailing 90th percentile prices).
Large-scale, high-margin, long mine life asset: 16-year mine life with average annual production of 26 Moz AgEq at an AISC of $12.35/oz AgEq.
Low capital intensity: initial development capex of $368 M; attractive NPV-to-capex ratio of 3.2x.
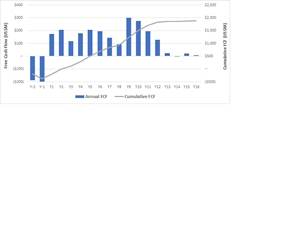
Rapid payback: post-tax payback of 2.0 years for Base Case and 1.4 years for Upside Case.
Technically robust study: 99% of tonnes processed in the PEA mine plan are in the Measured & Indicated category; process design and metallurgical recovery estimates are based on the Company’s comprehensive 2021 metallurgical testwork program.
Silver-dominant revenues: silver represents +60% of the net smelter return in the first five years of the mine life and +50% of the net smelter return over the life of mine, in-line with the senior/mid-tier silver producer group.
Taj Singh, President and CEO, states: “With annual AgEq production averaging more than 26 Moz over a +15-year mine life we believe this PEA clearly positions Cordero as a Tier 1 silver asset. This impressive scale of production is achieved through modest development capex of $368 M and returns excellent margins with AISC averaging less than $12.50/AgEq oz over the life of the mine. These costs highlight the benefits of existing local infrastructure, excellent metallurgy, and a straight-forward open pit mine with excellent grades and a low strip ratio.
“Importantly, the outstanding metrics demonstrated in the PEA are supported by a mine plan with more than 99% of tonnes in the Measured and Indicated category, and a simple and conventional process design based on our detailed metallurgical testwork program completed earlier this year. This provides us with a huge head start as we look ahead to the delivery of a Prefeasibility Study on Cordero in 2022.”
PEA SUMMARY:
Study support:
The Study is based on the updated Mineral Resource Estimate (“Resource”) press released on October 20, 2021 (see Appendices for Resource details), and the Company’s comprehensive metallurgical testwork program described in our press release dated September 7, 2021.
The PEA project team was led by Ausenco Engineering Canada Inc. (“Ausenco”), an industry leader in cost-effective design and construction. Ausenco was supported by AGP Mining Consultants Inc. (“AGP”) and Knight Piésold and Co. (USA) (“Knight Piésold”).
Project Economics:
Sensitivity of the Project’s expected after-tax NPV, IRR and payback at different commodity price assumptions is outlined in the table below:
Units | Base Case | Upside Case | Base Case +15% | Base Case -15% | |||||||||
After-Tax NPV (5% discount rate) | (US$ M) | $1,160 | $1,889 | $1,692 | $622 | ||||||||
Internal Rate of Return | (%) | 38.2 | % | 54.6 | % | 49.9 | % | 25.2 | % | ||||
Payback | (yrs) | 2.0 | 1.4 | 1.6 | 3.5 | ||||||||
Base Case price assumptions: Ag = $22.00/oz, Au = $1,600/oz, Pb = $1.00/lb, Zn = $1.20/lb
Upside Case price assumptions: Ag = $27.50/oz, Au = $1,880/oz, Pb = $1.10/lb, Zn = $1.45/lb based on one-year trailing 90th percentile prices
After-Tax Free Cash Flow:
A chart summarizing the expected annual and cumulative after-tax free cash flow (“FCF”) over the life-of-mine (“LOM”) is provided below:
https://www.globenewswire.com/NewsRoom/AttachmentNg/d1131062-ffa4-4091-b528-d23ac46806b3
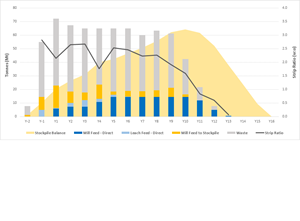
Production & Costs:
Annual production over the LOM is expected to average 26 Moz AgEq with production averaging over 33 Moz AgEq when fully ramped up (Years 5 – 12); this positions Cordero as one of the largest silver mines globally.
Units | Year 1 – 4 | Year 5 - 12 | Year 13 -16 | LOM | |||||
AgEq Produced - Average | (Moz) | 29 | 33 | 9 | 26 | ||||
AgEq Payable - Average | (Moz) | 26 | 29 | 8 | 23 | ||||
AgEq Produced - Total | (Moz) | 117 | 265 | 37 | 426 | ||||
AgEq Payable - Total | (Moz) | 104 | 230 | 32 | 372 | ||||
All-In Sustaining Cost (AISC) | (US$/AgEq oz) | $11.64 | $11.77 | $18.88 | $12.35 | ||||
Note – LOM production/payable totals include production from Year -1. AgEq Produced is metal recovered in doré/concentrate. AgEq Payable is metal payable from doré/concentrate and incorporates metal payment terms outlined in the Concentrate Terms section below. See Technical Disclosure section for AgEq and AISC calculation methodology.
LOM Production & AISC:
https://www.globenewswire.com/NewsRoom/AttachmentNg/dc1da013-9e05-4a0a-a7af-78b58ef8af4a
Note – Au/Pb/Zn production is shown on an AgEq basis based on: Ag = $22/oz, Au = $1,600/oz, Pb = $1.00/lb and Zn = $1.20/lb
OPERATIONS:
Mining:
The mine plan incorporates accelerated stripping as well as stockpiling of low-grade material in order to optimize the grade profile over the LOM.
The mine plan was completed by AGP and is based on a detailed mine design that incorporates mining dilution, safety berms and haul roads.
Mining rates over the life of the mine are relatively steady at 60 to 70 Mtpa.
The ultimate pit contains 719 Mt in total consisting of 228 Mt of mill feed and 491 Mt of waste for an average strip ratio of 2.2:1. The strip ratio is relatively even over the LOM.
Pit slope designs were based on an assessment by Knight Piésold that was supported by two geotechnical coreholes in the North Corridor and logging of core from two exploration coreholes in the South Corridor.
Processing:
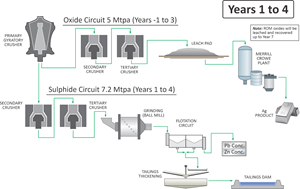
Processing was broken into two phases to optimize the capital efficiency of the project.
Phase 1 throughput (Year -1 to Year 4)
Oxides: mined during the preproduction period and are crushed through the Phase 1 crushing plant and stacked on the heap leach from Year -1 to Year 3 at a throughput rate of 5 Mtpa. After Year 3 the Phase 1 crushing plant is dedicated to processing higher-value sulphide material with remaining oxide material processed as uncrushed ‘run-of-mine’ (“ROM”) material via heap leaching.
Sulphides: crushing, grinding and flotation circuit is constructed in Year -1 and processing occurs at a nameplate rate of 7.2 Mtpa from Year 1 to Year 4. During this period the mine plan focuses on high-grade material from the Pozo de Plata zone.
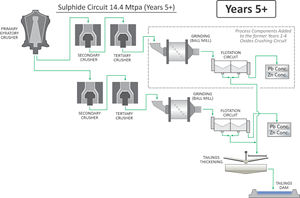
Phase 2 throughput (Year 5+)
Sulphides: two identical crushing, grinding and flotation circuits from Y5 onwards with total throughput of 14.4 Mtpa
Annual Throughput (Mt/a) | PHASE 1 | PHASE 2 | ||||
Year -1 | Year 1 | Year 2 | Year 3 | Year 4 | Year 5+ | |
Oxides / Heap Leach (Crushed) | 5.0 | 5.0 | 5.0 | 5.0 | - | - |
Sulphides / Milling | - | 5.8 | 7.2 | 7.2 | 10.8 | 14.4 |
Total Tonnes | 5.0 | 10.8 | 12.2 | 12.2 | 10.8 | 14.4 |
Process design
Oxides: three-stage crushing (targeted crush size of 8 mm), agglomeration, heap leaching and refining in Year -1 to Year 3 and ROM dump leaching and refining in Year 4 to Year 6 to produce Ag-Au doré bars
Sulphides: three-stage crushing, grinding (targeted grind size of 200 micron) and flotation to produce Pb and Zn concentrates
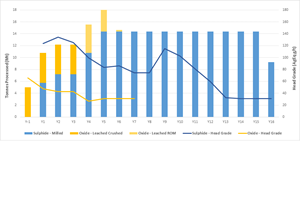
Head grades:
The mine plan focuses on feeding higher grades to the mill earlier in the mine life:
Year 1 – 4: processing of higher-grade oxide material from the South Corridor and sulphide material predominantly from the Pozo de Plata zone
Year 5 – 12: processing of higher-grade sulphides from the NE Extension and the South Corridor
Year 13 – 16: processing of lower-grade material stockpiled during Year 1 to Year 12
HEAD GRADES | UNIT | PHASE 1 | PHASE 2 | LOM | |
Year 1 – 4 | Year 5 – 12 | Year 13 – 16 | |||
Oxides | |||||
Tonnes processed | (Mt) | 25 | 4 | - | 29 |
Ag | (g/t) | 37 | 29 | - | 36 |
Au | (g/t) | 0.08 | 0.05 | - | 0.08 |
AgEq | (g/t) | 43 | 33 | - | 42 |
Sulphides | |||||
Tonnes processed | (Mt) | 31 | 115 | 52 | 199 |
Ag | (g/t) | 57 | 32 | 13 | 31 |
Au | (g/t) | 0.26 | 0.07 | 0.04 | 0.09 |
Pb | (%) | 0.80 | 0.50 | 0.17 | 0.46 |
Zn | (%) | 0.80 | 0.92 | 0.34 | 0.75 |
AgEq | (g/t) | 118 | 88 | 34 | 80 |
Note – Phase 1 and LOM Oxide tonnes/grades include tonnes processed on the heap leach in Year -1
Recoveries:
Oxides: recoveries were based on coarse bottle roll tests and preliminary results from column leach tests completed in 2021. Recoveries average 56% for Ag and 63% for Au for crushed feed and 36% for Ag and 35% for Au for uncrushed ROM feed.
Sulphides: recoveries were based on the 2021 metallurgical test program which included lock-cycle tests and examined metal recoveries to the silver-lead concentrate and the silver-zinc concentrate at varying head grades for each of the major geological rock types at Cordero. Metal recoveries to the two concentrates are summarized below:
SULPHIDE RECOVERIES (weighted average) | PHASE 1 | PHASE 2 | LOM | |||||
Year 1 – 4 | Year 5 – 12 | Year 13 – 16 | ||||||
Ag | 92% | 83% | 67% | 84% | ||||
Au | 19% | 19% | 19% | 19% | ||||
Pb | 90% | 86% | 69% | 86% | ||||
Zn | 85% | 86% | 74% | 85% | ||||
Tailings Management Facility (TMF):
The TMF design was completed by Knight Piésold and is based on a conventional thickened tailings dam facility of downstream construction type.
The TMF is located directly west of the open pit. The design incorporates five dam lifts over the LOM.
Total capacity of the TMF is 179M m3 (252 Mt); this is significantly greater than the estimated volume requirement of 142M m3 based on the PEA mine plan.
An evaluation of using a dry-stacked tailings facility will be completed as part of pre-feasibility work.
CONCENTRATE TERMS:
Metal Payable:
Cordero is expected to produce clean, highly saleable concentrates with minimal penalty elements as established in the 2021 metallurgical test program.
Industry standard payables and deductions were applied to the Pb and Zn concentrates as per the table below. A metallurgical balance summary is included in the Appendices.
Approximately 85% of the Ag reports to the Pb concentrate where higher payabilities are received.
Ag | Au | Pb | Zn | |||||
Pb Concentrate | ||||||||
Average concentrate grade LOM | 2,900 g/t | 1.6 g/t | 52 | % | - | |||
Payable metal | 95 | % | 95 | % | 95 | % | - | |
Minimum deduction | 50 g/t | 1 g/t | 3 units | - | ||||
Zn Concentrate | ||||||||
Average concentrate grade LOM | 300 g/t | 0.5 g/t | - | 51 | % | |||
Payable metal | 70 | % | 70 | % | - | 85 | % | |
Deduction | 3 oz/t | 1 g/t | - | - | ||||
Treatment/Refining Charges:
Treatment and refining charges were based on a review of spot and recent benchmark pricing and are summarized as follows:
PARAMETER | UNITS | PEA COST | SPOT | 2021 BENCHMARK | ||
TREATMENT/REFINING CHARGES | ||||||
Treatment charge – Pb con | $/dmt | $100 | ~$60 | $140 | ||
Treatment charge – Zn con | $/dmt | $200 | ~$80 | $160 | ||
Ag refining charge – Pb con | $/oz | $1.00 | ~$0.75 | $1.50 | ||
Concentrate Transportation:
Transportation costs assume trucking of the concentrate via containers to the international port at Guaymas, Sonora, and then shipping via ocean freight to Asia.
Estimated transportation costs (trucking, port handling and ocean freight) are $128/wmt for Pb concentrate and $116/wmt for Zn concentrate.
CAPITAL EXPENDITURES:
Initial Capital (for parallel processing of crushed oxides and sulphides)
Year -2: construction of on-site infrastructure, power line and the heap leach circuit with capacity of 5 Mtpa to process oxide/transition material (includes a three-stage oxide crushing circuit, heap leach pad/ponds and Merrill Crowe plant).
Year -1: first sulphide circuit with a capacity of 7.2 Mtpa (includes sulphide crushing circuit, ball mill and flotation plant) and construction of the TMF including the initial dam lift.
Expansion Capital (to expand plant to 14.4 Mtpa sulphides only)
Year 3: addition of second sulphide circuit to expand processing rate to 14.4 Mtpa by the addition of a ball mill and flotation circuit creating two parallel sulphide circuits. The crushing circuit previously used for oxides will be dedicated to sulphides from Year 4 onwards and will not require repurposing.
Year 8: expand flotation circuit with additional flotation cells, cyclones, filters and thickeners to accommodate the higher zinc grades from Year 9 to Year 11.
Sustaining Capital
TMF: the tailings dam will be completed in five lifts over the LOM at a total capital cost of $110 M ($15 M initial capex plus $95 M of sustaining capex).
Other: additional sustaining capex totals $113 M over the LOM and includes sustaining capital for the process plant and mobile equipment and replacements/refurbishments of infrastructure assets.
DESCRIPTION (all in US$ millions) | INITIAL CAPITAL | EXPANSION CAPITAL | SUSTAINING LOM CAPEX | TOTAL | |||||||||
Year -2 | Year -1 | Year 3 | Year 8 | ||||||||||
CAPITAL EXPENDITURES | |||||||||||||
Mining | $26 | $1 | $7 | $33 | |||||||||
Infrastructure | $34 | $9 | $10 | $16 | $69 | ||||||||
Heap Leach + Oxide Plant | $71 | $1 | $4 | $76 | |||||||||
Sulphide Processing Plant | $95 | $51 | $23 | $30 | $199 | ||||||||
Tailings Facility (TMF) | $15 | $95 | $110 | ||||||||||
Indirects | $22 | $30 | $17 | $6 | $4 | $78 | |||||||
Owners Costs | $6 | $6 | |||||||||||
Closure (net of Salvage Value) | $22 | $22 | |||||||||||
Contingency | $28 | $30 | $16 | $6 | $29 | $110 | |||||||
Capital Expenditures - Subtotals | $187 | $181 | $94 | $35 | $208 | $704 | |||||||
$368 | |||||||||||||
PRE-SULPHIDE OPERATIONS | |||||||||||||
Revenue | $121 | ||||||||||||
Mining Costs | ($110) | ||||||||||||
Process + G&A Costs | ($27) | ||||||||||||
Operating Cash Flow for Year -1 | ($16) | ||||||||||||
NET FUNDING REQUIREMENT | $384 | ||||||||||||
OPERATING COST ASSUMPTIONS:
Mining:
Mining is assumed to be completed by contract mining; estimated mining costs were based on contractor quotes for Cordero received by AGP
Processing and G&A Costs:
Processing costs for the heap leach and mill/flotation, and G&A costs were developed by Ausenco from first principles.
Sulphide processing costs benefit from a conventional flotation process design and low power costs. The targeted coarse grind size of 200 micron alleviates the need for a SAG mill.
G&A costs estimates are based on a small camp and administration office at site. The majority of the work force will be Mexican nationals commuting daily from the local town of Parral. Parral is 25 km south of Cordero and has a population of approximately 100,000. It is the regional government centre in the southern part of Chihuahua State and has a well-established service industry that supports numerous local mining operations.
PARAMETER | UNITS | PEA COST | |
OPERATING COSTS | |||
Mining – Mill Feed | $/t mined | $2.16 | |
Mining – Waste | $/t mined | $2.04 | |
Processing – Heap leach crushed | $/t stacked | $3.84 | |
Processing – Heap leach ROM | $/t stacked | $1.39 | |
Processing – Milling (7.2 Mtpa) | $/t milled | $7.01 | |
Processing – Milling (14.4 Mtpa) | $/t milled | $6.57 | |
Site G&A (14.4 Mtpa) | $/t milled | $0.86 | |
OPPORTUNITIES:
Work completed during the preparation of the PEA outlined a number of opportunities that have the potential to improve the economic and ESG performance of the project:
Mine life extension: there are over 300 Mt of Sulphide Resource that sit outside the PEA design pit but within the Resource pit shell. These resources as summarized below have the potential to extend the mine life and/or increase production levels at higher commodity prices.
Class | Tonnes | Grade | Contained Metal | |||||||||
Ag | Au | Pb | Zn | AgEq | Ag | Au | Pb | Zn | AgEq | |||
(Mt) | (g/t) | (g/t) | (%) | (%) | (g/t) | (Moz) | (koz) | (Mlb) | (Mlb) | (Moz) | ||
Measured | 33 | 15 | 0.06 | 0.21 | 0.42 | 38 | 16 | 63 | 151 | 306 | 40 | |
Indicated | 187 | 16 | 0.04 | 0.23 | 0.45 | 40 | 94 | 221 | 952 | 1,869 | 238 | |
M&I | 220 | 16 | 0.04 | 0.23 | 0.45 | 39 | 110 | 284 | 1,103 | 2,175 | 278 | |
Inferred | 106 | 14 | 0.03 | 0.19 | 0.38 | 34 | 48 | 97 | 445 | 897 | 117 | |
Note – the full Resource is provided in the Appendix; further details can be found in the Company’s October 21, 2021, press release.
Coarser grind size: metallurgical test work suggests higher recoveries may be achieved at coarse grind sizes (greater than the 200 micron used in the PEA). An evaluation of coarse particle flotation will be completed as part of the 2022 Prefeasibility Study (“PFS”). Coarse particle flotation has the potential to further reduce operating costs and water consumption.
Dry stack tailings: an evaluation of using dry stacked tailings to improve ESG performance will be completed as part of the PFS.
TECHNICAL DISCLOSURE:
Inferred material, representing 0.9% of the mill feed, is included in the total mill feed. Inferred resources are considered too speculative geologically to have economic considerations applied to them that would enable them to be categorized as reserves.
Mineral resources that are not mineral reserves do not have demonstrated economic viability.
Readers are cautioned that the PEA is preliminary in nature and that there is no certainty the estimates utilized in the PEA will be realized.
A full technical report will be prepared in accordance with NI 43-101 and will be filed on SEDAR within 45 days of this press release.
AgEq is calculated based on the following commodity prices: Ag - $22.00/oz, Au - $1,600/oz, Pb - $1.00/lb and Zn - $1.20/lb.
All-in Sustaining cost (AISC) is calculated as: [Operating costs (mining, processing and G&A) + Royalties + Concentrate Transportation + Treatment & Refining Charges + Concentrate Penalties + Sustaining Capital (includes capital for TMF dams lifts with capacity for less than five years) + Closure Costs] / Payable AgEq ounces
APPENDIX:
An appendix with the following supporting information can be found at the end of the release or the following link: Appendices
Appendix A - Mineral Resource Estimate
Appendix B – After-Tax NPV/IRR/Payback Sensitivities
Appendix C - Pit Optimisation Parameters
Appendix D - LOM Mine Plan Summary
Appendix E - LOM Process Throughput Summary
Appendix F - Simplified Process Flowsheets
Appendix G – Metallurgical Balance Summary
Appendix H - Long Sections / Cross Sections
Appendix I - Site Layout
Appendix J - LOM Production & Cash Flow Schedule
About Discovery:
Discovery’s flagship project is its 100%-owned Cordero project, one of the world’s largest silver deposits. The PEA completed in November 2021 demonstrates that Cordero has the potential to be developed into a highly capital efficient mine that offers the combination of margin, size and scaleability. Cordero is located close to infrastructure in a prolific mining belt in Chihuahua State, Mexico. Continued exploration and project development at Cordero is supported by an industry leading balance sheet with cash of over C$75 million. Discovery was a recipient of the 2020 TSX Venture 50 award and the 2021 OTCQX Best 50 award.
On Behalf of the Board of Directors,
Taj Singh, M.Eng, P.Eng, CPA,
President, Chief Executive Officer and Director
For further information contact:
Forbes Gemmell, CFA
VP Corporate Development & Investor Relations
Phone: 416-613-9410
Email: forbes.gemmell@discoverysilver.com
Website: www.discoverysilver.com
Qualified Person
The PEA for the Company’s Cordero project as summarized in this release was completed by Ausenco with support from by AGP and Knight Piésold. A full technical report supporting the PEA will be prepared in accordance with NI 43-101 and will be filed on SEDAR within 45 days of this press release. The scientific and technical content of this press release was reviewed and approved by Taj Singh, P Eng., President & CEO, who is a "Qualified Person" as defined by National Instrument 43-101 - Standards of Disclosure for Mineral Projects ("NI 43-101").
FORWARD-LOOKING STATEMENTS:
Neither TSX Venture Exchange nor its Regulation Services Provider (as that term is defined in policies of the TSX Venture Exchange) accepts responsibility for the adequacy or accuracy of this release.
This news release is not for distribution to United States newswire services or for dissemination in the United States.
This news release does not constitute an offer to sell or a solicitation of an offer to buy nor shall there be any sale of any of the securities in any jurisdiction in which such offer, solicitation or sale would be unlawful, including any of the securities in the United States of America. The securities have not been and will not be registered under the United States Securities Act of 1933, as amended (the “1933 Act”) or any state securities laws and may not be offered or sold within the United States or to, or for account or benefit of, U.S. Persons (as defined in Regulation S under the 1933 Act) unless registered under the 1933 Act and applicable state securities laws, or an exemption from such registration requirements is available.
Cautionary Note Regarding Forward-Looking Statements
This news release may include forward-looking statements that are subject to inherent risks and uncertainties. All statements within this news release, other than statements of historical fact, are to be considered forward looking. Although Discovery believes the expectations expressed in such forward-looking statements are based on reasonable assumptions, such statements are not guarantees of future performance and actual results or developments may differ materially from those described in forward-looking statements. Factors that could cause actual results to differ materially from those described in forward-looking statements include fluctuations in market prices, including metal prices, continued availability of capital and financing, and general economic, market or business conditions. There can be no assurances that such statements will prove accurate and, therefore, readers are advised to rely on their own evaluation of such uncertainties. Discovery does not assume any obligation to update any forward-looking statements except as required under applicable laws.
APPENDIX A – MINERAL RESOURCE ESTIMATE
SULPHIDE RESOURCE (assumed to be processed via mill/flotation)
NSR $/t | Class | Tonnes | Grade | Contained Metal | ||||||||
Ag | Au | Pb | Zn | AgEq | Ag | Au | Pb | Zn | AgEq | |||
(Mt) | (g/t) | (g/t) | (%) | (%) | (g/t) | (Moz) | (koz) | (Mlb) | (Mlb) | (Moz) | ||
$7.25/t | Measured | 128 | 22 | 0.08 | 0.31 | 0.52 | 52 | 89 | 328 | 881 | 1,470 | 212 |
Indicated | 413 | 19 | 0.05 | 0.28 | 0.51 | 47 | 255 | 707 | 2,543 | 4,663 | 625 | |
M&I | 541 | 20 | 0.06 | 0.29 | 0.51 | 48 | 344 | 1,035 | 3,424 | 6,132 | 837 | |
Inferred | 108 | 14 | 0.03 | 0.19 | 0.38 | 34 | 49 | 99 | 451 | 909 | 119 | |
OXIDE/TRANSITION RESOURCE (assumed to be processed by heap leaching)
NSR $/t | Class | Tonnes | Grade | Contained Metal | % Oxide / % | ||||
Ag | Au | AgEq | Ag | Au | AgEq | ||||
(Mt) | (g/t) | (g/t) | (g/t) | (Moz) | (koz) | (Moz) | |||
$4.78/t | Measured | 23 | 20 | 0.06 | 25 | 15 | 43 | 19 | 92% / 8% |
Indicated | 75 | 19 | 0.05 | 23 | 45 | 125 | 56 | 87% / 13% | |
M&I | 98 | 19 | 0.05 | 23 | 60 | 168 | 74 | 88% / 12% | |
Inferred | 35 | 16 | 0.04 | 20 | 18 | 44 | 22 | 63% / 37% | |
SUPPORTING TECHNICAL DISCLOSURE FOR RESOURCE:
Mineral resources that are not mineral reserves do not have demonstrated economic viability.
AgEq for the Sulphide Resource is calculated as Ag + (Au x 16.07) + (Pb x 32.55) + (Zn x 35.10); these factors are based on commodity prices of Ag - $24.00/oz, Au - $1,800/oz, Pb - $1.10/lb, Zn - $1.20/lb and assumed recoveries of Ag – 84%, Au – 18%, Pb – 87% and Zn – 88%.
AgEq for the Oxide/Transition Resource is calculated as Ag + (Au x 87.5); this factor is based on commodity prices of Ag - $24.00/oz and Au - $1,800/oz and assumed recoveries of Ag – 60% and Au – 70%.
The Resource is constrained by a pit optimisation based on the following commodity prices: Ag - $24.00/oz, Au - $1,800/oz, Pb - $1.10/lb, Zn - $1.20/lb. Additional parameters for the pit constraint are provided in the Company’s October 20, 2021, press release.
Individual metals are reported at 100% of in-situ grade.
The effective date of the Resource is October 20, 2021, and is based on drilling through July 2021.
There are no known legal, political, environmental or other risks that could materially affect the potential development of the Resource.
A full technical report supporting the Resource will be prepared in accordance with NI 43-101 and will be filed on SEDAR within 45 days of the October 20, 2021, Resource press release.
APPENDIX B: AFTER-TAX NPV / IRR / PAYBACK SENSITIVITIES
Sensitivity of the Project’s NPV, IRR and payback at different Ag and Zn price assumptions is outlined in the table below. For these sensitivities the Au and Pb prices have been fixed at $1,600/oz and $1.00/lb respectively. The Base Case scenario for the PEA is highlighted in grey below and assumes Ag - $22.00/oz, Au - $1,600/oz, Pb - $1.00/lb and Zn - $1.20/lb.
Ag ($/oz) | |||||||||||||||||||||||||||
$18.00 | $20.00 | $22.00 | $25.00 | $30.00 | |||||||||||||||||||||||
NPV | IRR | Payback | NPV | IRR | Payback | NPV | IRR | Payback | NPV | IRR | Payback | NPV | IRR | Payback | |||||||||||||
(US$M) | (%) | (yrs) | (US$M) | (%) | (yrs) | (US$M) | (%) | (yrs) | (US$M) | (%) | (yrs) | (US$M) | (%) | (yrs) | |||||||||||||
Zn | $1.05 | $715 | 27.2 | % | 3.3 | $866 | 31.5 | % | 2.7 | $1,016 | 35.8 | % | 2.2 | $1,238 | 42.0 | % | 1.8 | $1,607 | 52.5 | % | 1.4 | ||||||
$1.10 | $765 | 28.2 | % | 3.2 | $915 | 32.4 | % | 2.6 | $1,064 | 36.6 | % | 2.1 | $1,286 | 42.8 | % | 1.8 | $1,655 | 53.2 | % | 1.4 | |||||||
$1.20 | $863 | 30.0 | % | 3.1 | $1,013 | 34.1 | % | 2.5 | $1,160 | 38.2 | % | 2.0 | $1,382 | 44.3 | % | 1.7 | $1,751 | 54.5 | % | 1.4 | |||||||
$1.30 | $961 | 31.7 | % | 2.9 | $1,109 | 35.8 | % | 2.3 | $1,257 | 39.7 | % | 2.0 | $1,478 | 45.7 | % | 1.7 | $1,848 | 55.8 | % | 1.4 | |||||||
$1.45 | $1,105 | 34.2 | % | 2.7 | $1,253 | 38.1 | % | 2.2 | $1,401 | 42.0 | % | 1.9 | $1,622 | 47.8 | % | 1.6 | $1,992 | 57.8 | % | 1.3 | |||||||
APPENDIX C - PIT OPTIMISATION PARAMETERS:
The PEA mine plan was based on a pit optimization that utilised the following parameters:
PARAMETER | UNITS | Ag | Au | Pb | Zn | ||||||||
COMMODITY PRICES | $/oz or $/lb | $ | 20.00 | $ | 1,600 | $ | 0.95 | $ | 1.05 | ||||
ROYALTY | % | 0.5 | % | 0.5 | % | - | - | ||||||
PIT SLOPE ASSUMPTIONS | Five sectors were modeled based on core logging and two geotechnical holes with inter-ramp angles ranging from 40o to 59o | ||||||||||||
PROCESS RECOVERIES | |||||||||||||
Heap Leach (Oxide/Transition) | % | 60 | % | 70 | % | - | - | ||||||
Flotation (Sulphide) | |||||||||||||
Breccia – Volcanic | |||||||||||||
Recovery to Pb concentrate | % | 79 | % | 13 | % | 91 | % | - | |||||
Recovery to Zn concentrate | % | 11 | % | 7 | % | - | 88 | % | |||||
Breccia – Sedimentary | |||||||||||||
Recovery to Pb concentrate | % | 75 | % | 12 | % | 89 | % | - | |||||
Recovery to Zn concentrate | % | 9 | % | 4 | % | - | 86 | % | |||||
Volcanic | |||||||||||||
Recovery to Pb concentrate | % | 70 | % | 13 | % | 85 | % | - | |||||
Recovery to Zn concentrate | % | 13 | % | 6 | % | - | 81 | % | |||||
Sedimentary | |||||||||||||
Recovery to Pb concentrate | % | 70 | % | 13 | % | 83 | % | - | |||||
Recovery to Zn concentrate | % | 10 | % | 5 | % | - | 89 | % | |||||
METAL PAYABLE | |||||||||||||
Dore (Heap Leach) | 98 | % | 99.9 | % | - | - | |||||||
Concentrate (Flotation) | |||||||||||||
Pb concentrate | 95 | % | 95 | % | 95 | % | - | ||||||
Zn concentrate | 70 | % | 70 | % | - | 85 | % | ||||||
OPERATING COSTS | Base | Per 10m below 1550m elev. | |||||||||||
Mining cost – Mill Feed | $/t mined | $ | 1.54 | +$ | 0.024 | ||||||||
Mining cost - Waste | $/t mined | $ | 1.64 | +$ | 0.024 | ||||||||
Processing cost – Heap leach (14,000 tpd) | $/t stacked | $ | 3.92 | ||||||||||
Processing cost – Flotation (40,000 tpd) | $/t milled | $ | 6.39 | ||||||||||
G&A (40,000 tpd) | $/t milled | $ | 0.86 | ||||||||||
TREATMENT/REFINING CHARGES | |||||||||||||
Treatment charge – Pb con | $/dmt | $ | 100 | ||||||||||
Treatment charge – Zn con | $/dmt | $ | 200 | ||||||||||
Ag refining charge – Pb con | $/oz | $ | 1.00 | ||||||||||
APPENDIX D - LOM MINE PLAN SUMMARY
https://www.globenewswire.com/NewsRoom/AttachmentNg/8166015b-ee80-4827-b8e3-23bacc987d76
APPENDIX E - LOM PROCESS THROUGHPUT SUMMARY
https://www.globenewswire.com/NewsRoom/AttachmentNg/8166015b-ee80-4827-b8e3-23bacc987d76
APPENDIX F - SIMPLIFIED PROCESS FLOWSHEETS
https://www.globenewswire.com/NewsRoom/AttachmentNg/b88056d2-d72a-4018-bf8f-b849b808fdc9
PHASE 1:
https://www.globenewswire.com/NewsRoom/AttachmentNg/885c2668-aea9-4dea-ba22-ed401e1821c3
PHASE 2:
https://www.globenewswire.com/NewsRoom/AttachmentNg/cb701e57-5f13-428e-8935-165e82a05cea
APPENDIX G – METALLURGICAL BALANCE SUMMARY
UNITS | PHASE 1 | PHASE 2 | LOM | ||||||||||||||||||||||||||||||
Years 1 - 4 | Years 5 - 12 | Years 13 - 16 | |||||||||||||||||||||||||||||||
Ag | Au | Pb | Zn | Ag | Au | Pb | Zn | Ag | Au | Pb | Zn | Ag | Au | Pb | Zn | ||||||||||||||||||
MET BALANCE | |||||||||||||||||||||||||||||||||
Average head grade | g/t or % | 57 | 0.26 | 0.80 | 0.80 | 32 | 0.07 | 0.50 | 0.92 | 13 | 0.04 | 0.17 | 0.34 | 31 | 0.09 | 0.46 | 0.75 | ||||||||||||||||
Recovered to Pb Con | % | 81 | % | 13 | % | 90 | % | 6 | % | 71 | % | 13 | % | 86 | % | 6 | % | 56 | % | 13 | % | 69 | % | 3 | % | 73 | % | 13 | % | 86 | % | 5 | % |
Recovered to Zn Con | % | 12 | % | 6 | % | 3 | % | 85 | % | 12 | % | 6 | % | 3 | % | 86 | % | 11 | % | 6 | % | 3 | % | 74 | % | 12 | % | 6 | % | 3 | % | 85 | % |
Tailings | % | 7 | % | 81 | % | 7 | % | 9 | % | 17 | % | 81 | % | 11 | % | 8 | % | 33 | % | 81 | % | 28 | % | 22 | % | 16 | % | 81 | % | 11 | % | 10 | % |
Total | % | 100 | % | 100 | % | 100 | % | 100 | % | 100 | % | 100 | % | 100 | % | 100 | % | 100 | % | 100 | % | 100 | % | 100 | % | 100 | % | 100 | % | 100 | % | 100 | % |
CONCENTRATE GRADES | |||||||||||||||||||||||||||||||||
Pb Concentrate | g/t or % | 3,490 | 2.5 | 54 | % | - | 2,802 | 1.1 | 52 | % | - | 2,657 | 2.1 | 43 | % | - | 2,939 | 1.6 | 52 | % | - | ||||||||||||
Zn Concentrate | g/t or % | 524 | 1.3 | - | 52 | % | 254 | 0.3 | - | 51 | % | 285 | 0.5 | - | 50 | % | 298 | 0.5 | - | 51 | % | ||||||||||||
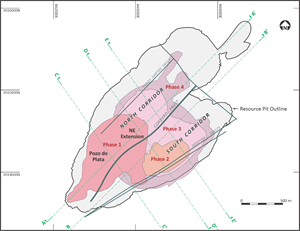
APPENDIX H - LONG SECTIONS / CROSS SECTIONS:
https://www.globenewswire.com/NewsRoom/AttachmentNg/5771cce0-8ad4-46df-8646-38d597111fd2
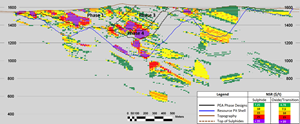
LONG SECTION A-A’ (looking NW)
https://www.globenewswire.com/NewsRoom/AttachmentNg/3c5a9654-d929-49f3-aa0e-7848e33ba990
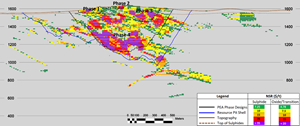
LONG SECTION B-B’ (looking NW)
https://www.globenewswire.com/NewsRoom/AttachmentNg/f6c7f47c-cba9-4350-971d-2811424eae5e
CROSS SECTION C-C’ (looking NE)
https://www.globenewswire.com/NewsRoom/AttachmentNg/15065795-2109-4f47-9c2b-bd5929581770
CROSS SECTION D-D’ (looking NE)
https://www.globenewswire.com/NewsRoom/AttachmentNg/bf7ee835-3444-44b1-8cd4-5cb9f9c9d951
CROSS SECTION E-E’ (looking NE)
https://www.globenewswire.com/NewsRoom/AttachmentNg/1b503900-7edc-4827-9b5d-7372bc5ebe8d
APPENDIX I - SITE LAYOUT:
https://www.globenewswire.com/NewsRoom/AttachmentNg/a92066eb-ca65-4ac8-91f5-fba03c554b65
APPENDIX J – PRODUCTION & CASH FLOW SCHEDULE:
Units | Total/Avg | Y-2 | Y-1 | Y1 | Y2 | Y3 | Y4 | Y5 | Y6 | Y7 | Y8 | Y9 | Y10 | Y11 | Y12 | Y13 | Y14 | Y15 | Y16 | Y17+ | |||||||||||||||||||||||||||||||||||||||||
MINING | |||||||||||||||||||||||||||||||||||||||||||||||||||||||||||||
Mineralized Material Mined | mt | 228 | 1 | 14 | 23 | 18 | 18 | 24 | 18 | 19 | 19 | 19 | 21 | 16 | 12 | 5 | 0 | -- | -- | -- | -- | ||||||||||||||||||||||||||||||||||||||||
Waste Mined | mt | 491 | 6 | 41 | 49 | 49 | 47 | 41 | 47 | 46 | 41 | 44 | 40 | 26 | 10 | 3 | 0 | -- | -- | -- | -- | ||||||||||||||||||||||||||||||||||||||||
Total Material Mined | mt | 719 | 8 | 55 | 72 | 67 | 65 | 65 | 65 | 65 | 60 | 63 | 61 | 42 | 22 | 8 | 0 | -- | -- | -- | -- | ||||||||||||||||||||||||||||||||||||||||
Mining Rate | ktpd | 137 | 22 | 157 | 206 | 192 | 186 | 186 | 186 | 186 | 171 | 181 | 175 | 121 | 62 | 22 | 1 | -- | -- | -- | |||||||||||||||||||||||||||||||||||||||||
Strip Ratio | w:o | 2.2 | |||||||||||||||||||||||||||||||||||||||||||||||||||||||||||
