
 Yahoo Finance
 Do Directors Own Constellation Software Inc. (TSE:CSU) Shares?

The big shareholder groups in Constellation Software Inc. (TSE:CSU) have power over the company. Institutions often own shares in more established companies, while it’s not unusual to see insiders own a fair bit of smaller companies. I quite like to see at least a little bit of insider ownership. As Charlie Munger said ‘Show me the incentive and I will show you the outcome.’
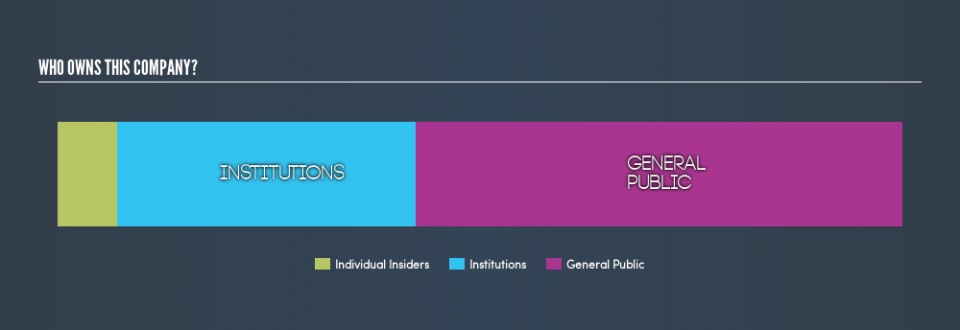
Constellation Software is a pretty big company. It has a market capitalization of CA$24b. Normally institutions would own a significant portion of a company this size. In the chart below below, we can see that institutions are noticeable on the share registry. Let’s delve deeper into each type of owner, to discover more about CSU.
View our latest analysis for Constellation Software
What Does The Institutional Ownership Tell Us About Constellation Software?
Institutional investors commonly compare their own returns to the returns of a commonly followed index. So they generally do consider buying larger companies that are included in the relevant benchmark index.
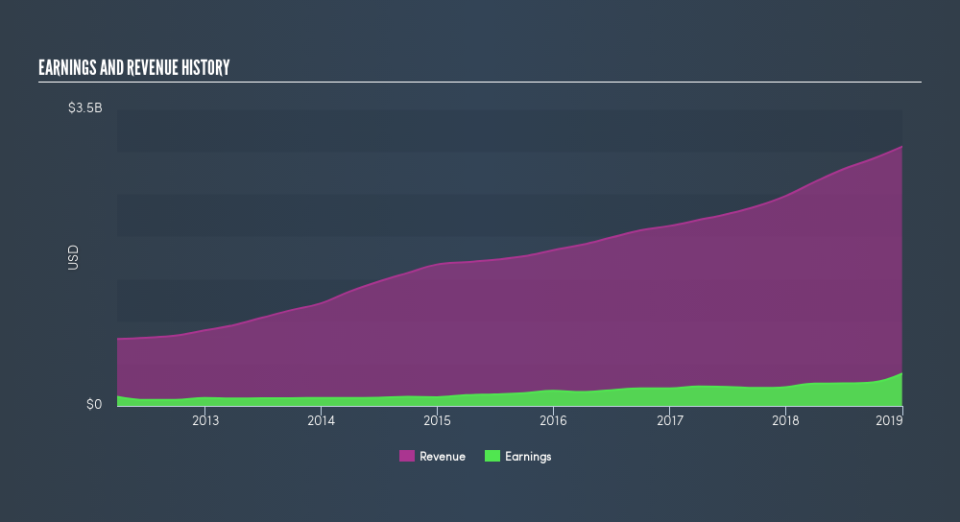
Constellation Software already has institutions on the share registry. Indeed, they own 35% of the company. This suggests some credibility amongst professional investors. But we can’t rely on that fact alone, since institutions make bad investments sometimes, just like everyone does. If multiple institutions change their view on a stock at the same time, you could see the share price drop fast. It’s therefore worth looking at Constellation Software’s earnings history, below. Of course, the future is what really matters.
We note that hedge funds don’t have a meaningful investment in Constellation Software. Quite a few analysts cover the stock, so you could look into forecast growth quite easily.
Insider Ownership Of Constellation Software
While the precise definition of an insider can be subjective, almost everyone considers board members to be insiders. Company management run the business, but the CEO will answer to the board, even if he or she is a member of it.
Most consider insider ownership a positive because it can indicate the board is well aligned with other shareholders. However, on some occasions too much power is concentrated within this group.
Shareholders would probably be interested to learn that insiders own shares in Constellation Software Inc.. Insiders own CA$1.7b worth of shares (at current prices). It is good to see this level of investment. You can check here to see if those insiders have been buying recently.
General Public Ownership
The general public, who are mostly retail investors, collectively hold 57% of Constellation Software shares. This level of ownership gives retail investors the power to sway key policy decisions such as board composition, executive compensation, and the dividend payout ratio.
Next Steps:
It’s always worth thinking about the different groups who own shares in a company. But to understand Constellation Software better, we need to consider many other factors.
I like to dive deeper into how a company has performed in the past. You can access this interactive graph of past earnings, revenue and cash flow, for free .
If you are like me, you may want to think about whether this company will grow or shrink. Luckily, you can check this free report showing analyst forecasts for its future.
NB: Figures in this article are calculated using data from the last twelve months, which refer to the 12-month period ending on the last date of the month the financial statement is dated. This may not be consistent with full year annual report figures.
We aim to bring you long-term focused research analysis driven by fundamental data. Note that our analysis may not factor in the latest price-sensitive company announcements or qualitative material.
If you spot an error that warrants correction, please contact the editor at editorial-team@simplywallst.com. This article by Simply Wall St is general in nature. It does not constitute a recommendation to buy or sell any stock, and does not take account of your objectives, or your financial situation. Simply Wall St has no position in the stocks mentioned. Thank you for reading.
