
 Yahoo Finance
 Direct Line Insurance Group (LON:DLG) Has Compensated Shareholders With A 25% Return On Their Investment
For many, the main point of investing is to generate higher returns than the overall market. But every investor is virtually certain to have both over-performing and under-performing stocks. At this point some shareholders may be questioning their investment in Direct Line Insurance Group plc (LON:DLG), since the last five years saw the share price fall 15%.
View our latest analysis for Direct Line Insurance Group
In his essay The Superinvestors of Graham-and-Doddsville Warren Buffett described how share prices do not always rationally reflect the value of a business. By comparing earnings per share (EPS) and share price changes over time, we can get a feel for how investor attitudes to a company have morphed over time.
Looking back five years, both Direct Line Insurance Group's share price and EPS declined; the latter at a rate of 1.5% per year. Readers should note that the share price has fallen faster than the EPS, at a rate of 3% per year, over the period. So it seems the market was too confident about the business, in the past. The low P/E ratio of 11.61 further reflects this reticence.
The image below shows how EPS has tracked over time (if you click on the image you can see greater detail).
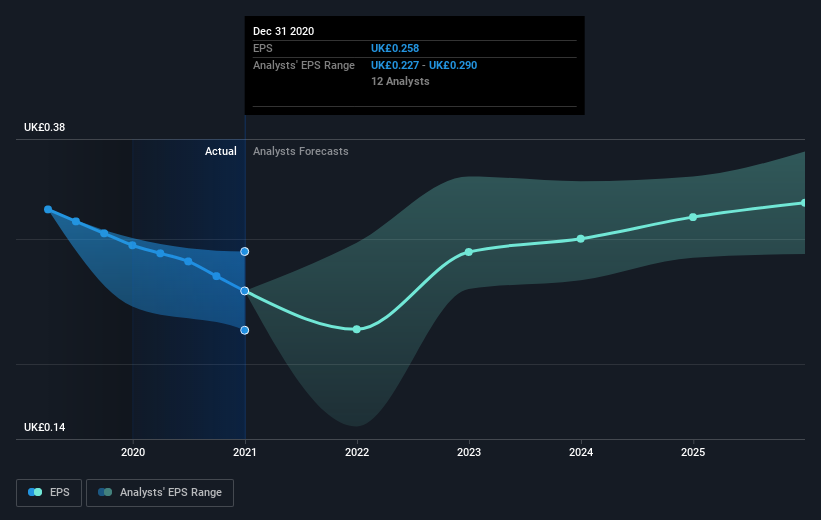
Dive deeper into Direct Line Insurance Group's key metrics by checking this interactive graph of Direct Line Insurance Group's earnings, revenue and cash flow.
What About Dividends?
It is important to consider the total shareholder return, as well as the share price return, for any given stock. The TSR is a return calculation that accounts for the value of cash dividends (assuming that any dividend received was reinvested) and the calculated value of any discounted capital raisings and spin-offs. Arguably, the TSR gives a more comprehensive picture of the return generated by a stock. We note that for Direct Line Insurance Group the TSR over the last 5 years was 25%, which is better than the share price return mentioned above. This is largely a result of its dividend payments!
A Different Perspective
Direct Line Insurance Group provided a TSR of 17% over the last twelve months. But that was short of the market average. On the bright side, that's still a gain, and it's actually better than the average return of 5% over half a decade This could indicate that the company is winning over new investors, as it pursues its strategy. While it is well worth considering the different impacts that market conditions can have on the share price, there are other factors that are even more important. Consider risks, for instance. Every company has them, and we've spotted 2 warning signs for Direct Line Insurance Group you should know about.
Of course, you might find a fantastic investment by looking elsewhere. So take a peek at this free list of companies we expect will grow earnings.
Please note, the market returns quoted in this article reflect the market weighted average returns of stocks that currently trade on GB exchanges.
This article by Simply Wall St is general in nature. It does not constitute a recommendation to buy or sell any stock, and does not take account of your objectives, or your financial situation. We aim to bring you long-term focused analysis driven by fundamental data. Note that our analysis may not factor in the latest price-sensitive company announcements or qualitative material. Simply Wall St has no position in any stocks mentioned.
Have feedback on this article? Concerned about the content? Get in touch with us directly. Alternatively, email editorial-team (at) simplywallst.com.
