
 Yahoo Finance
 Did RYB Education Inc (NYSE:RYB) Create Value For Investors Over The Past Year?

This analysis is intended to introduce important early concepts to people who are starting to invest and want to begin learning the link between company’s fundamentals and stock market performance.
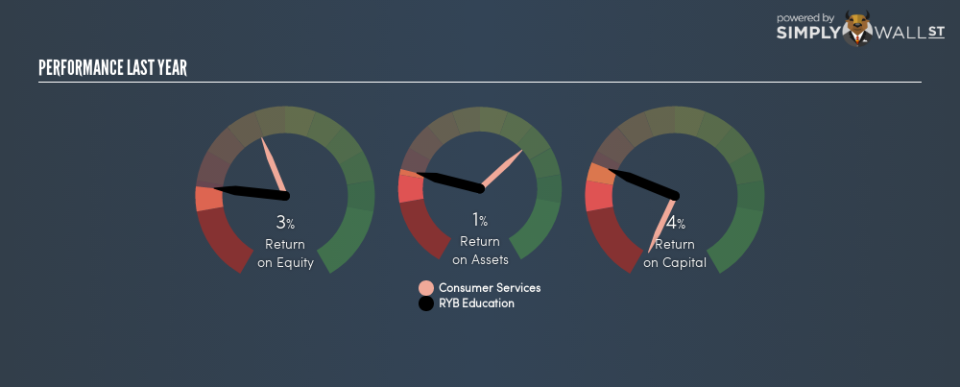
RYB Education Inc (NYSE:RYB) delivered a less impressive 2.6% ROE over the past year, compared to the 12.5% return generated by its industry. Though RYB’s recent performance is underwhelming, it is useful to understand what ROE is made up of and how it should be interpreted. Knowing these components can change your views on RYB’s below-average returns. I will take you through how metrics such as financial leverage impact ROE which may affect the overall sustainability of RYB’s returns.
See our latest analysis for RYB Education
Peeling the layers of ROE – trisecting a company’s profitability
Return on Equity (ROE) is a measure of RYB Education’s profit relative to its shareholders’ equity. It essentially shows how much the company can generate in earnings given the amount of equity it has raised. While a higher ROE is preferred in most cases, there are several other factors we should consider before drawing any conclusions.
Return on Equity = Net Profit ÷ Shareholders Equity
ROE is measured against cost of equity in order to determine the efficiency of RYB Education’s equity capital deployed. Its cost of equity is 10.0%. Since RYB Education’s return does not cover its cost, with a difference of -7.4%, this means its current use of equity is not efficient and not sustainable. Very simply, RYB Education pays more for its capital than what it generates in return. ROE can be dissected into three distinct ratios: net profit margin, asset turnover, and financial leverage. This is called the Dupont Formula:
Dupont Formula
ROE = profit margin × asset turnover × financial leverage
ROE = (annual net profit ÷ sales) × (sales ÷ assets) × (assets ÷ shareholders’ equity)
ROE = annual net profit ÷ shareholders’ equity
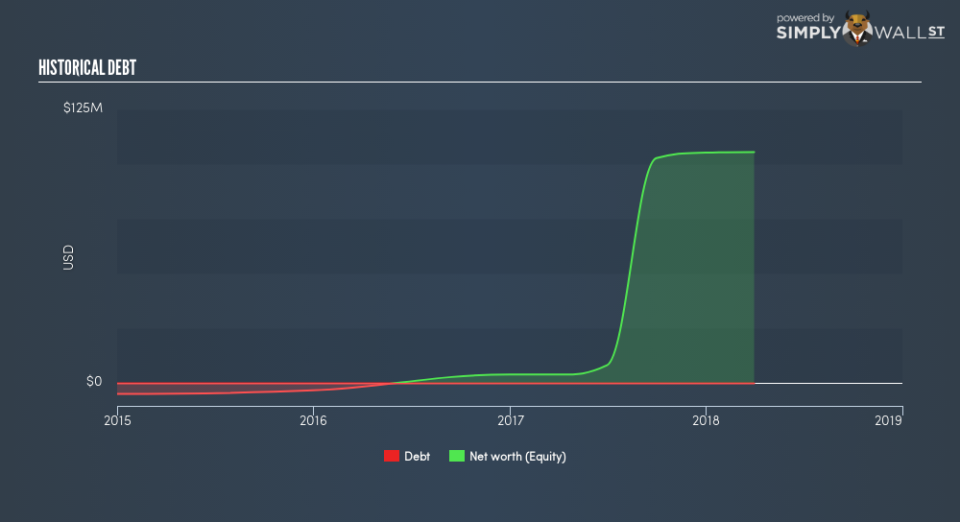
Basically, profit margin measures how much of revenue trickles down into earnings which illustrates how efficient the business is with its cost management. Asset turnover shows how much revenue RYB Education can generate with its current asset base. And finally, financial leverage is simply how much of assets are funded by equity, which exhibits how sustainable the company’s capital structure is. Since ROE can be artificially increased through excessive borrowing, we should check RYB Education’s historic debt-to-equity ratio. Currently, RYB Education has no debt which means its returns are driven purely by equity capital. This could explain why RYB Education’s’ ROE is lower than its industry peers, most of which may have some degree of debt in its business.
Next Steps:
ROE is one of many ratios which meaningfully dissects financial statements, which illustrates the quality of a company. RYB Education’s ROE is underwhelming relative to the industry average, and its returns were also not strong enough to cover its own cost of equity. However, ROE is not likely to be inflated by excessive debt funding, giving shareholders more conviction in the sustainability of returns, which has headroom to increase further. ROE is a helpful signal, but it is definitely not sufficient on its own to make an investment decision.
For RYB Education, I’ve compiled three fundamental aspects you should further research:
Financial Health: Does it have a healthy balance sheet? Take a look at our free balance sheet analysis with six simple checks on key factors like leverage and risk.
Valuation: What is RYB Education worth today? Is the stock undervalued, even when its growth outlook is factored into its intrinsic value? The intrinsic value infographic in our free research report helps visualize whether RYB Education is currently mispriced by the market.
Other High-Growth Alternatives : Are there other high-growth stocks you could be holding instead of RYB Education? Explore our interactive list of stocks with large growth potential to get an idea of what else is out there you may be missing!
To help readers see past the short term volatility of the financial market, we aim to bring you a long-term focused research analysis purely driven by fundamental data. Note that our analysis does not factor in the latest price-sensitive company announcements.
The author is an independent contributor and at the time of publication had no position in the stocks mentioned. For errors that warrant correction please contact the editor at editorial-team@simplywallst.com.
