
 Yahoo Finance
 Did You Participate In Any Of Sun Life Financial's (TSE:SLF) Respectable 51% Return?

When we invest, we're generally looking for stocks that outperform the market average. And the truth is, you can make significant gains if you buy good quality businesses at the right price. For example, the Sun Life Financial Inc. (TSE:SLF) share price is up 25% in the last 5 years, clearly besting the market return of around 16% (ignoring dividends).
Check out our latest analysis for Sun Life Financial
While markets are a powerful pricing mechanism, share prices reflect investor sentiment, not just underlying business performance. One flawed but reasonable way to assess how sentiment around a company has changed is to compare the earnings per share (EPS) with the share price.
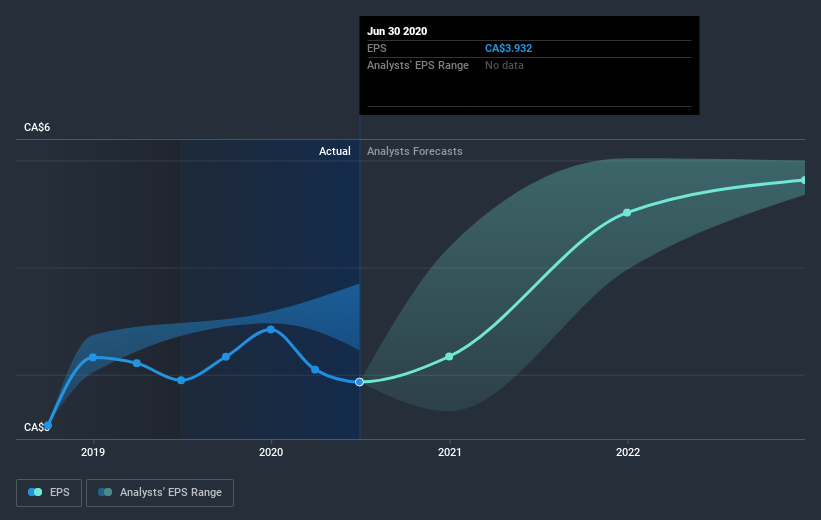
Over half a decade, Sun Life Financial managed to grow its earnings per share at 2.7% a year. This EPS growth is lower than the 5% average annual increase in the share price. This suggests that market participants hold the company in higher regard, these days. That's not necessarily surprising considering the five-year track record of earnings growth.
The image below shows how EPS has tracked over time (if you click on the image you can see greater detail).
We like that insiders have been buying shares in the last twelve months. Even so, future earnings will be far more important to whether current shareholders make money. It might be well worthwhile taking a look at our free report on Sun Life Financial's earnings, revenue and cash flow.
What About Dividends?
It is important to consider the total shareholder return, as well as the share price return, for any given stock. Whereas the share price return only reflects the change in the share price, the TSR includes the value of dividends (assuming they were reinvested) and the benefit of any discounted capital raising or spin-off. Arguably, the TSR gives a more comprehensive picture of the return generated by a stock. We note that for Sun Life Financial the TSR over the last 5 years was 51%, which is better than the share price return mentioned above. This is largely a result of its dividend payments!
A Different Perspective
While the broader market lost about 0.06% in the twelve months, Sun Life Financial shareholders did even worse, losing 1.5% (even including dividends). Having said that, it's inevitable that some stocks will be oversold in a falling market. The key is to keep your eyes on the fundamental developments. Longer term investors wouldn't be so upset, since they would have made 9%, each year, over five years. It could be that the recent sell-off is an opportunity, so it may be worth checking the fundamental data for signs of a long term growth trend. Investors who like to make money usually check up on insider purchases, such as the price paid, and total amount bought. You can find out about the insider purchases of Sun Life Financial by clicking this link.
There are plenty of other companies that have insiders buying up shares. You probably do not want to miss this free list of growing companies that insiders are buying.
Please note, the market returns quoted in this article reflect the market weighted average returns of stocks that currently trade on CA exchanges.
This article by Simply Wall St is general in nature. It does not constitute a recommendation to buy or sell any stock, and does not take account of your objectives, or your financial situation. We aim to bring you long-term focused analysis driven by fundamental data. Note that our analysis may not factor in the latest price-sensitive company announcements or qualitative material. Simply Wall St has no position in any stocks mentioned.
Have feedback on this article? Concerned about the content? Get in touch with us directly. Alternatively, email editorial-team@simplywallst.com.
