
 Yahoo Finance
 Did Great Ajax's (NYSE:AJX) Share Price Deserve to Gain 11%?

These days it's easy to simply buy an index fund, and your returns should (roughly) match the market. But investors can boost returns by picking market-beating companies to own shares in. To wit, the Great Ajax Corp. (NYSE:AJX) share price is 11% higher than it was a year ago, much better than the market return of around 0.7% (not including dividends) in the same period. That's a solid performance by our standards! Zooming out, the stock is up 11% in the last three years.
View our latest analysis for Great Ajax
To quote Buffett, 'Ships will sail around the world but the Flat Earth Society will flourish. There will continue to be wide discrepancies between price and value in the marketplace...' By comparing earnings per share (EPS) and share price changes over time, we can get a feel for how investor attitudes to a company have morphed over time.
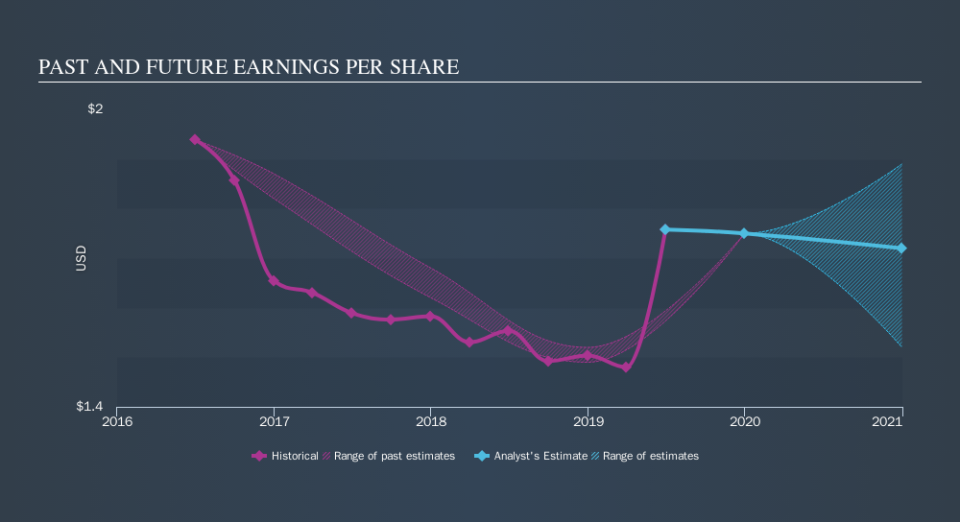
During the last year Great Ajax grew its earnings per share (EPS) by 13%. We note that the earnings per share growth isn't far from the share price growth (of 11%). That suggests that the market sentiment around the company hasn't changed much over that time. We don't think its coincidental that the share price is growing at a similar rate to the earnings per share.
The image below shows how EPS has tracked over time (if you click on the image you can see greater detail).
It's probably worth noting that the CEO is paid less than the median at similar sized companies. But while CEO remuneration is always worth checking, the really important question is whether the company can grow earnings going forward. Before buying or selling a stock, we always recommend a close examination of historic growth trends, available here..
What About Dividends?
As well as measuring the share price return, investors should also consider the total shareholder return (TSR). Whereas the share price return only reflects the change in the share price, the TSR includes the value of dividends (assuming they were reinvested) and the benefit of any discounted capital raising or spin-off. It's fair to say that the TSR gives a more complete picture for stocks that pay a dividend. As it happens, Great Ajax's TSR for the last year was 23%, which exceeds the share price return mentioned earlier. And there's no prize for guessing that the dividend payments largely explain the divergence!
A Different Perspective
We're pleased to report that Great Ajax rewarded shareholders with a total shareholder return of 23% over the last year. That includes the value of the dividend. That's better than the annualized TSR of 13% over the last three years. The improving returns to shareholders suggests the stock is becoming more popular with time. Before forming an opinion on Great Ajax you might want to consider the cold hard cash it pays as a dividend. This free chart tracks its dividend over time.
If you like to buy stocks alongside management, then you might just love this free list of companies. (Hint: insiders have been buying them).
Please note, the market returns quoted in this article reflect the market weighted average returns of stocks that currently trade on US exchanges.
We aim to bring you long-term focused research analysis driven by fundamental data. Note that our analysis may not factor in the latest price-sensitive company announcements or qualitative material.
If you spot an error that warrants correction, please contact the editor at editorial-team@simplywallst.com. This article by Simply Wall St is general in nature. It does not constitute a recommendation to buy or sell any stock, and does not take account of your objectives, or your financial situation. Simply Wall St has no position in the stocks mentioned. Thank you for reading.
