
 Yahoo Finance
 Did Changing Sentiment Drive Prudential Financial's (NYSE:PRU) Share Price Down By 11%?

Prudential Financial, Inc. (NYSE:PRU) shareholders should be happy to see the share price up 13% in the last month. But that doesn't change the reality of under-performance over the last twelve months. After all, the share price is down 11% in the last year, significantly under-performing the market.
See our latest analysis for Prudential Financial
In his essay The Superinvestors of Graham-and-Doddsville Warren Buffett described how share prices do not always rationally reflect the value of a business. By comparing earnings per share (EPS) and share price changes over time, we can get a feel for how investor attitudes to a company have morphed over time.
Unhappily, Prudential Financial had to report a 43% decline in EPS over the last year. The share price fall of 11% isn't as bad as the reduction in earnings per share. So despite the weak per-share profits, some investors are probably relieved the situation wasn't more difficult.
You can see how EPS has changed over time in the image below (click on the chart to see the exact values).
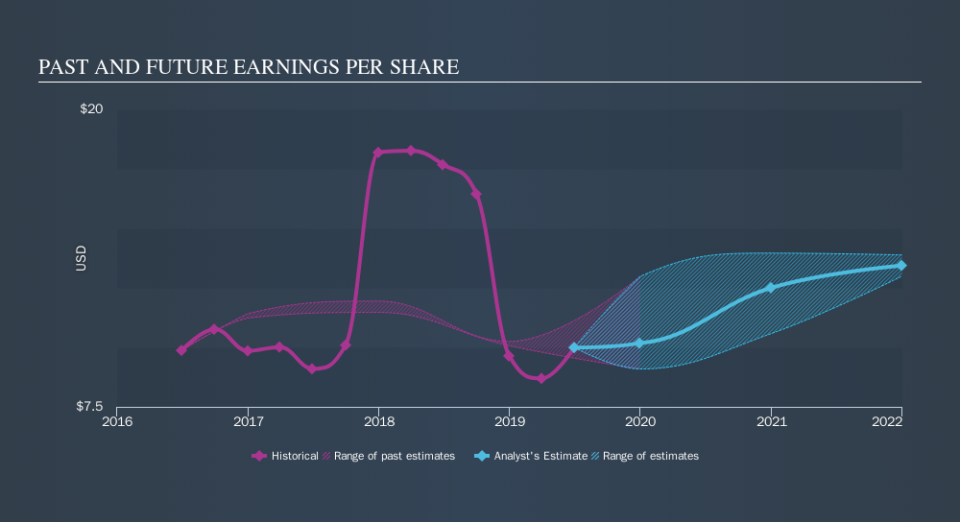
It's good to see that there was some significant insider buying in the last three months. That's a positive. On the other hand, we think the revenue and earnings trends are much more meaningful measures of the business. Dive deeper into the earnings by checking this interactive graph of Prudential Financial's earnings, revenue and cash flow.
What About Dividends?
As well as measuring the share price return, investors should also consider the total shareholder return (TSR). The TSR is a return calculation that accounts for the value of cash dividends (assuming that any dividend received was reinvested) and the calculated value of any discounted capital raisings and spin-offs. It's fair to say that the TSR gives a more complete picture for stocks that pay a dividend. In the case of Prudential Financial, it has a TSR of -7.1% for the last year. That exceeds its share price return that we previously mentioned. And there's no prize for guessing that the dividend payments largely explain the divergence!
A Different Perspective
Investors in Prudential Financial had a tough year, with a total loss of 7.1% (including dividends) , against a market gain of about 2.0%. However, keep in mind that even the best stocks will sometimes underperform the market over a twelve month period. Longer term investors wouldn't be so upset, since they would have made 4.2%, each year, over five years. It could be that the recent sell-off is an opportunity, so it may be worth checking the fundamental data for signs of a long term growth trend. It is all well and good that insiders have been buying shares, but we suggest you check here to see what price insiders were buying at.
Prudential Financial is not the only stock that insiders are buying. For those who like to find winning investments this free list of growing companies with recent insider purchasing, could be just the ticket.
Please note, the market returns quoted in this article reflect the market weighted average returns of stocks that currently trade on US exchanges.
We aim to bring you long-term focused research analysis driven by fundamental data. Note that our analysis may not factor in the latest price-sensitive company announcements or qualitative material.
If you spot an error that warrants correction, please contact the editor at editorial-team@simplywallst.com. This article by Simply Wall St is general in nature. It does not constitute a recommendation to buy or sell any stock, and does not take account of your objectives, or your financial situation. Simply Wall St has no position in the stocks mentioned. Thank you for reading.
