
 Yahoo Finance
 Did Changing Sentiment Drive Petrus Resources's (TSE:PRQ) Share Price Down A Painful 91%?

As an investor, mistakes are inevitable. But really bad investments should be rare. So consider, for a moment, the misfortune of Petrus Resources Ltd. (TSE:PRQ) investors who have held the stock for three years as it declined a whopping 91%. That might cause some serious doubts about the merits of the initial decision to buy the stock, to put it mildly. And over the last year the share price fell 82%, so we doubt many shareholders are delighted. The falls have accelerated recently, with the share price down 47% in the last three months.
We really hope anyone holding through that price crash has a diversified portfolio. Even when you lose money, you don't have to lose the lesson.
View our latest analysis for Petrus Resources
While markets are a powerful pricing mechanism, share prices reflect investor sentiment, not just underlying business performance. One way to examine how market sentiment has changed over time is to look at the interaction between a company's share price and its earnings per share (EPS).
Petrus Resources became profitable within the last five years. That would generally be considered a positive, so we are surprised to see the share price is down. So given the share price is down it's worth checking some other metrics too.
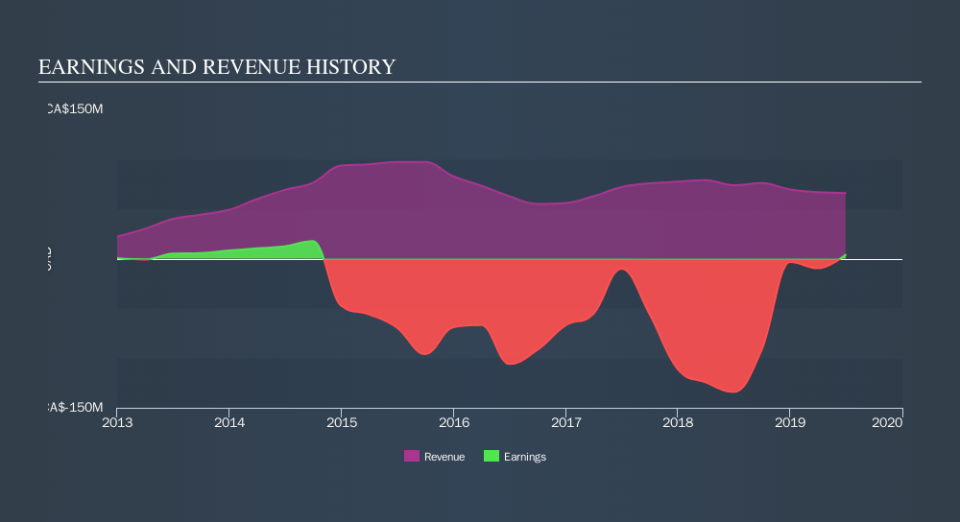
We note that, in three years, revenue has actually grown at a 5.7% annual rate, so that doesn't seem to be a reason to sell shares. This analysis is just perfunctory, but it might be worth researching Petrus Resources more closely, as sometimes stocks fall unfairly. This could present an opportunity.
The image below shows how earnings and revenue have tracked over time (if you click on the image you can see greater detail).
It is of course excellent to see how Petrus Resources has grown profits over the years, but the future is more important for shareholders. If you are thinking of buying or selling Petrus Resources stock, you should check out this FREE detailed report on its balance sheet.
A Different Perspective
Petrus Resources shareholders are down 82% for the year, but the broader market is up 4.8%. However, keep in mind that even the best stocks will sometimes underperform the market over a twelve month period. Shareholders have lost 55% per year over the last three years, so the share price drop has become steeper, over the last year; a potential symptom of as yet unsolved challenges. We would be wary of buying into a company with unsolved problems, although some investors will buy into struggling stocks if they believe the price is sufficiently attractive. Before spending more time on Petrus Resources it might be wise to click here to see if insiders have been buying or selling shares.
We will like Petrus Resources better if we see some big insider buys. While we wait, check out this free list of growing companies with considerable, recent, insider buying.
Please note, the market returns quoted in this article reflect the market weighted average returns of stocks that currently trade on CA exchanges.
We aim to bring you long-term focused research analysis driven by fundamental data. Note that our analysis may not factor in the latest price-sensitive company announcements or qualitative material.
If you spot an error that warrants correction, please contact the editor at editorial-team@simplywallst.com. This article by Simply Wall St is general in nature. It does not constitute a recommendation to buy or sell any stock, and does not take account of your objectives, or your financial situation. Simply Wall St has no position in the stocks mentioned. Thank you for reading.
