
 Yahoo Finance
 Did Changing Sentiment Drive Dunnedin Ventures's (CVE:DVI) Share Price Down A Painful 74%?

Want to participate in a short research study? Help shape the future of investing tools and you could win a $250 gift card!
The art and science of stock market investing requires a tolerance for losing money on some of the shares you buy. But it would be foolish to simply accept every extremely large loss as an inevitable part of the game. So we hope that those who held Dunnedin Ventures Inc. (CVE:DVI) during the last year don't lose the lesson, in addition to the 74% hit to the value of their shares. A loss like this is a stark reminder that portfolio diversification is important. Longer term investors have fared much better, since the share price is up 15% in three years. The last week also saw the share price slip down another 21%.
See our latest analysis for Dunnedin Ventures
To quote Buffett, 'Ships will sail around the world but the Flat Earth Society will flourish. There will continue to be wide discrepancies between price and value in the marketplace...' One flawed but reasonable way to assess how sentiment around a company has changed is to compare the earnings per share (EPS) with the share price.
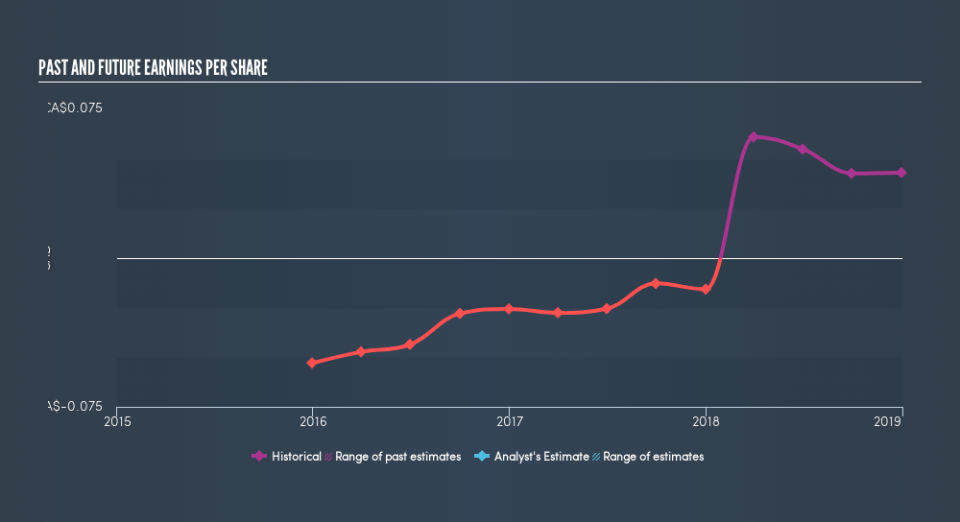
During the last year Dunnedin Ventures grew its earnings per share, moving from a loss to a profit. We're surprised that the share price is lower given that improvement. If the improved profitability is a sign of things to come, then right now may prove the perfect time to pop this stock on your watchlist.
The image below shows how EPS has tracked over time (if you click on the image you can see greater detail).
This free interactive report on Dunnedin Ventures's earnings, revenue and cash flow is a great place to start, if you want to investigate the stock further.
What about the Total Shareholder Return (TSR)?
We've already covered Dunnedin Ventures's share price action, but we should also mention its total shareholder return (TSR). The TSR is a return calculation that accounts for the value of cash dividends (assuming that any dividend received was reinvested) and the calculated value of any discounted capital raisings and spin-offs. Dunnedin Ventures hasn't been paying dividends, but its TSR of -74% exceeds its share price return of -74%, implying it has either spun-off a business, or raised capital at a discount; thereby providing additional value to shareholders.
A Different Perspective
Dunnedin Ventures shareholders are down 74% for the year, but the market itself is up 6.3%. However, keep in mind that even the best stocks will sometimes underperform the market over a twelve month period. On the bright side, long term shareholders have made money, with a gain of 23% per year over half a decade. If the fundamental data continues to indicate long term sustainable growth, the current sell-off could be an opportunity worth considering. Most investors take the time to check the data on insider transactions. You can click here to see if insiders have been buying or selling.
But note: Dunnedin Ventures may not be the best stock to buy. So take a peek at this free list of interesting companies with past earnings growth (and further growth forecast).
Please note, the market returns quoted in this article reflect the market weighted average returns of stocks that currently trade on CA exchanges.
We aim to bring you long-term focused research analysis driven by fundamental data. Note that our analysis may not factor in the latest price-sensitive company announcements or qualitative material.
If you spot an error that warrants correction, please contact the editor at editorial-team@simplywallst.com. This article by Simply Wall St is general in nature. It does not constitute a recommendation to buy or sell any stock, and does not take account of your objectives, or your financial situation. Simply Wall St has no position in the stocks mentioned. Thank you for reading.
