
 Yahoo Finance
 Did Changing Sentiment Drive CSS Industries's (NYSE:CSS) Share Price Down A Painful 86%?

Every investor on earth makes bad calls sometimes. But really big losses can really drag down an overall portfolio. So spare a thought for the long term shareholders of CSS Industries, Inc. (NYSE:CSS); the share price is down a whopping 86% in the last three years. That would certainly shake our confidence in the decision to own the stock. And the ride hasn't got any smoother in recent times over the last year, with the price 61% lower in that time. And the share price decline continued over the last week, dropping some 8.0%.
We really feel for shareholders in this scenario. It's a good reminder of the importance of diversification, and it's worth keeping in mind there's more to life than money, anyway.
See our latest analysis for CSS Industries
CSS Industries isn't currently profitable, so most analysts would look to revenue growth to get an idea of how fast the underlying business is growing. Generally speaking, companies without profits are expected to grow revenue every year, and at a good clip. That's because it's hard to be confident a company will be sustainable if revenue growth is negligible, and it never makes a profit.
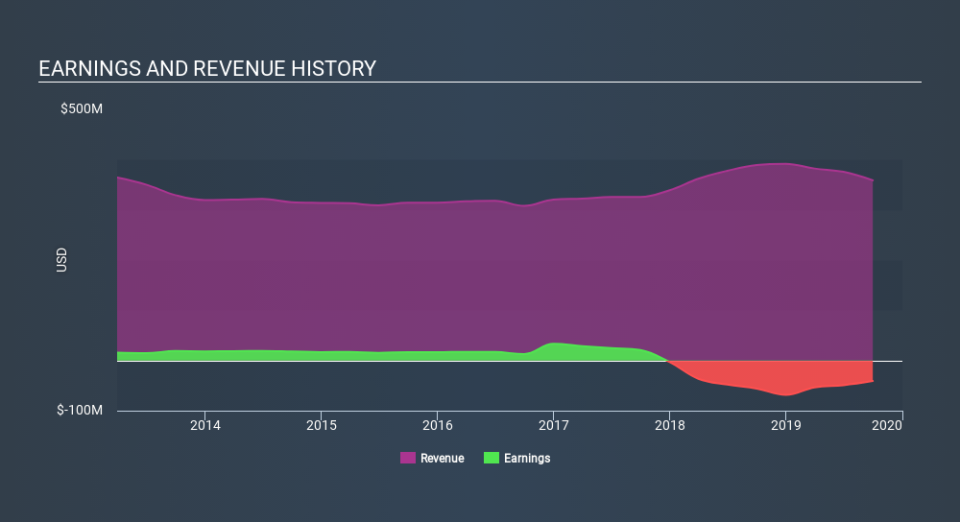
Over three years, CSS Industries grew revenue at 7.4% per year. Given it's losing money in pursuit of growth, we are not really impressed with that. Nonetheless, it's fair to say the rapidly declining share price (down 48%, compound, over three years) suggests the market is very disappointed with this level of growth. We generally don't try to 'catch the falling knife'. Of course, revenue growth is nice but generally speaking the lower the profits, the riskier the business - and this business isn't making steady profits.
The graphic below depicts how earnings and revenue have changed over time (unveil the exact values by clicking on the image).
We consider it positive that insiders have made significant purchases in the last year. Having said that, most people consider earnings and revenue growth trends to be a more meaningful guide to the business. This free interactive report on CSS Industries's earnings, revenue and cash flow is a great place to start, if you want to investigate the stock further.
What about the Total Shareholder Return (TSR)?
We'd be remiss not to mention the difference between CSS Industries's total shareholder return (TSR) and its share price return. The TSR attempts to capture the value of dividends (as if they were reinvested) as well as any spin-offs or discounted capital raisings offered to shareholders. CSS Industries's TSR of was a loss of 84% for the 3 years. That wasn't as bad as its share price return, because it has paid dividends.
A Different Perspective
CSS Industries shareholders are down 60% for the year, but the market itself is up 30%. Even the share prices of good stocks drop sometimes, but we want to see improvements in the fundamental metrics of a business, before getting too interested. Unfortunately, last year's performance may indicate unresolved challenges, given that it was worse than the annualised loss of 30% over the last half decade. Generally speaking long term share price weakness can be a bad sign, though contrarian investors might want to research the stock in hope of a turnaround. If you want to research this stock further, the data on insider buying is an obvious place to start. You can click here to see who has been buying shares - and the price they paid.
If you like to buy stocks alongside management, then you might just love this free list of companies. (Hint: insiders have been buying them).
Please note, the market returns quoted in this article reflect the market weighted average returns of stocks that currently trade on US exchanges.
If you spot an error that warrants correction, please contact the editor at editorial-team@simplywallst.com. This article by Simply Wall St is general in nature. It does not constitute a recommendation to buy or sell any stock, and does not take account of your objectives, or your financial situation. Simply Wall St has no position in the stocks mentioned.
We aim to bring you long-term focused research analysis driven by fundamental data. Note that our analysis may not factor in the latest price-sensitive company announcements or qualitative material. Thank you for reading.
