
 Yahoo Finance
 Despite shrinking by US$780m in the past week, DT Midstream (NYSE:DTM) shareholders are still up 21% over 1 year
DT Midstream, Inc. (NYSE:DTM) shareholders have seen the share price descend 15% over the month. But looking back over the last year, the returns have actually been rather pleasing! Looking at the full year, the company has easily bested an index fund by gaining 15%.
While this past week has detracted from the company's one-year return, let's look at the recent trends of the underlying business and see if the gains have been in alignment.
See our latest analysis for DT Midstream
To paraphrase Benjamin Graham: Over the short term the market is a voting machine, but over the long term it's a weighing machine. One way to examine how market sentiment has changed over time is to look at the interaction between a company's share price and its earnings per share (EPS).
During the last year, DT Midstream actually saw its earnings per share drop 1.3%.
We don't think that the decline in earnings per share is a good measure of the business over the last twelve months. It makes sense to check some of the other fundamental data for an explanation of the share price rise.
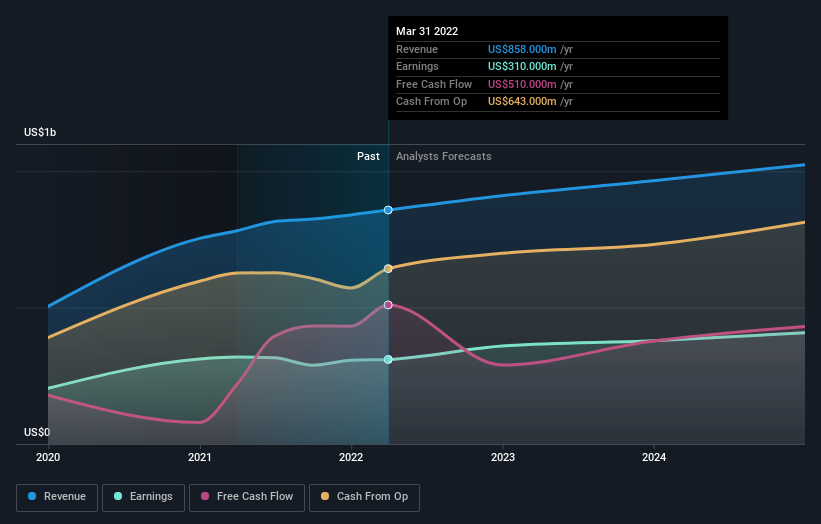
Absent any improvement, we don't think a thirst for dividends is pushing up the DT Midstream's share price. It seems far more likely that the 9.7% boost to the revenue over the last year, is making the difference. Revenue growth often does precede earnings growth, so some investors might be willing to forgo profits today because they have their eyes fixed firmly on the future.
The graphic below depicts how earnings and revenue have changed over time (unveil the exact values by clicking on the image).
If you are thinking of buying or selling DT Midstream stock, you should check out this FREE detailed report on its balance sheet.
What About Dividends?
As well as measuring the share price return, investors should also consider the total shareholder return (TSR). Whereas the share price return only reflects the change in the share price, the TSR includes the value of dividends (assuming they were reinvested) and the benefit of any discounted capital raising or spin-off. Arguably, the TSR gives a more comprehensive picture of the return generated by a stock. In the case of DT Midstream, it has a TSR of 21% for the last 1 year. That exceeds its share price return that we previously mentioned. And there's no prize for guessing that the dividend payments largely explain the divergence!
A Different Perspective
DT Midstream shareholders should be happy with the total gain of 21% over the last twelve months, including dividends. We regret to report that the share price is down 11% over ninety days. Shorter term share price moves often don't signify much about the business itself. I find it very interesting to look at share price over the long term as a proxy for business performance. But to truly gain insight, we need to consider other information, too. For example, we've discovered 2 warning signs for DT Midstream that you should be aware of before investing here.
But note: DT Midstream may not be the best stock to buy. So take a peek at this free list of interesting companies with past earnings growth (and further growth forecast).
Please note, the market returns quoted in this article reflect the market weighted average returns of stocks that currently trade on US exchanges.
Have feedback on this article? Concerned about the content? Get in touch with us directly. Alternatively, email editorial-team (at) simplywallst.com.
This article by Simply Wall St is general in nature. We provide commentary based on historical data and analyst forecasts only using an unbiased methodology and our articles are not intended to be financial advice. It does not constitute a recommendation to buy or sell any stock, and does not take account of your objectives, or your financial situation. We aim to bring you long-term focused analysis driven by fundamental data. Note that our analysis may not factor in the latest price-sensitive company announcements or qualitative material. Simply Wall St has no position in any stocks mentioned.
