
 Yahoo Finance
 Despite shrinking by UK£15m in the past week, hVIVO (LON:HVO) shareholders are still up 100% over 3 years
It's been a soft week for hVIVO plc (LON:HVO) shares, which are down 13%. But that shouldn't obscure the pleasing returns achieved by shareholders over the last three years. To wit, the share price did better than an index fund, climbing 79% during that period.
Since the long term performance has been good but there's been a recent pullback of 13%, let's check if the fundamentals match the share price.
Check out our latest analysis for hVIVO
hVIVO wasn't profitable in the last twelve months, it is unlikely we'll see a strong correlation between its share price and its earnings per share (EPS). Arguably revenue is our next best option. When a company doesn't make profits, we'd generally expect to see good revenue growth. Some companies are willing to postpone profitability to grow revenue faster, but in that case one does expect good top-line growth.
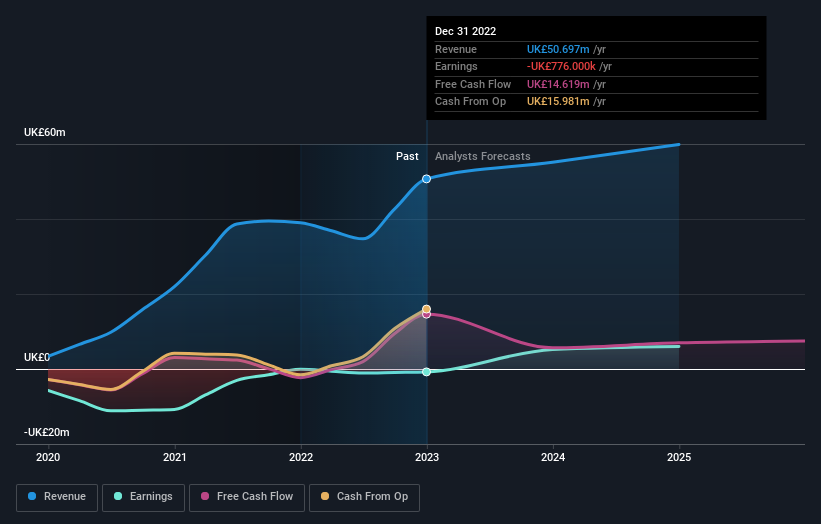
Over the last three years hVIVO has grown its revenue at 52% annually. That's well above most pre-profit companies. The share price rise of 21% per year throughout that time is nice to see, and given the revenue growth, that gain seems somewhat justified. So now might be the perfect time to put hVIVO on your radar. A window of opportunity may reveal itself with time, if the business can trend to profitability.
You can see below how earnings and revenue have changed over time (discover the exact values by clicking on the image).
Take a more thorough look at hVIVO's financial health with this free report on its balance sheet.
What About The Total Shareholder Return (TSR)?
Investors should note that there's a difference between hVIVO's total shareholder return (TSR) and its share price change, which we've covered above. Arguably the TSR is a more complete return calculation because it accounts for the value of dividends (as if they were reinvested), along with the hypothetical value of any discounted capital that have been offered to shareholders. hVIVO hasn't been paying dividends, but its TSR of 100% exceeds its share price return of 79%, implying it has either spun-off a business, or raised capital at a discount; thereby providing additional value to shareholders.
A Different Perspective
We're pleased to report that hVIVO rewarded shareholders with a total shareholder return of 11% over the last year. The TSR has been even better over three years, coming in at 26% per year. It's always interesting to track share price performance over the longer term. But to understand hVIVO better, we need to consider many other factors. Consider for instance, the ever-present spectre of investment risk. We've identified 1 warning sign with hVIVO , and understanding them should be part of your investment process.
If you are like me, then you will not want to miss this free list of growing companies that insiders are buying.
Please note, the market returns quoted in this article reflect the market weighted average returns of stocks that currently trade on British exchanges.
Have feedback on this article? Concerned about the content? Get in touch with us directly. Alternatively, email editorial-team (at) simplywallst.com.
This article by Simply Wall St is general in nature. We provide commentary based on historical data and analyst forecasts only using an unbiased methodology and our articles are not intended to be financial advice. It does not constitute a recommendation to buy or sell any stock, and does not take account of your objectives, or your financial situation. We aim to bring you long-term focused analysis driven by fundamental data. Note that our analysis may not factor in the latest price-sensitive company announcements or qualitative material. Simply Wall St has no position in any stocks mentioned.
Join A Paid User Research Session
You’ll receive a US$30 Amazon Gift card for 1 hour of your time while helping us build better investing tools for the individual investors like yourself. Sign up here
