
 Yahoo Finance
 Delta 9 Cannabis Inc. (TSE:DN) Looks Inexpensive But Perhaps Not Attractive Enough
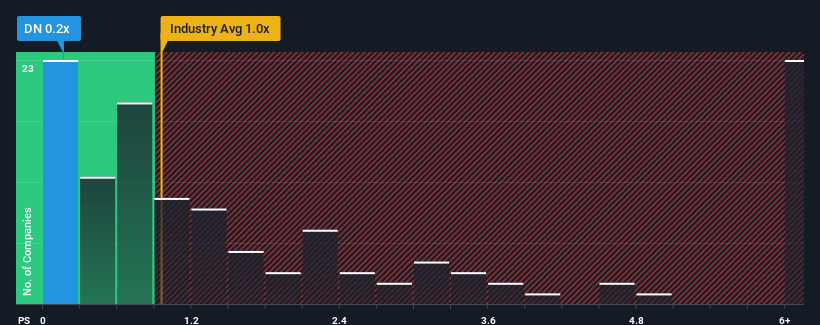
Delta 9 Cannabis Inc.'s (TSE:DN) price-to-sales (or "P/S") ratio of 0.2x might make it look like a buy right now compared to the Pharmaceuticals industry in Canada, where around half of the companies have P/S ratios above 1x and even P/S above 3x are quite common. Nonetheless, we'd need to dig a little deeper to determine if there is a rational basis for the reduced P/S.
See our latest analysis for Delta 9 Cannabis
What Does Delta 9 Cannabis' P/S Mean For Shareholders?
Delta 9 Cannabis could be doing better as it's been growing revenue less than most other companies lately. The P/S ratio is probably low because investors think this lacklustre revenue performance isn't going to get any better. If you still like the company, you'd be hoping revenue doesn't get any worse and that you could pick up some stock while it's out of favour.
Want the full picture on analyst estimates for the company? Then our free report on Delta 9 Cannabis will help you uncover what's on the horizon.
How Is Delta 9 Cannabis' Revenue Growth Trending?
In order to justify its P/S ratio, Delta 9 Cannabis would need to produce sluggish growth that's trailing the industry.
If we review the last year of revenue, the company posted a result that saw barely any deviation from a year ago. However, a few strong years before that means that it was still able to grow revenue by an impressive 99% in total over the last three years. So while the company has done a solid job in the past, it's somewhat concerning to see revenue growth decline as much as it has.
Shifting to the future, estimates from the only analyst covering the company suggest revenue should grow by 12% per year over the next three years. Meanwhile, the rest of the industry is forecast to expand by 16% per annum, which is noticeably more attractive.
With this in consideration, its clear as to why Delta 9 Cannabis' P/S is falling short industry peers. It seems most investors are expecting to see limited future growth and are only willing to pay a reduced amount for the stock.
The Bottom Line On Delta 9 Cannabis' P/S
Using the price-to-sales ratio alone to determine if you should sell your stock isn't sensible, however it can be a practical guide to the company's future prospects.
As we suspected, our examination of Delta 9 Cannabis' analyst forecasts revealed that its inferior revenue outlook is contributing to its low P/S. Right now shareholders are accepting the low P/S as they concede future revenue probably won't provide any pleasant surprises. It's hard to see the share price rising strongly in the near future under these circumstances.
Before you settle on your opinion, we've discovered 5 warning signs for Delta 9 Cannabis (3 are concerning!) that you should be aware of.
If strong companies turning a profit tickle your fancy, then you'll want to check out this free list of interesting companies that trade on a low P/E (but have proven they can grow earnings).
Have feedback on this article? Concerned about the content? Get in touch with us directly. Alternatively, email editorial-team (at) simplywallst.com.
This article by Simply Wall St is general in nature. We provide commentary based on historical data and analyst forecasts only using an unbiased methodology and our articles are not intended to be financial advice. It does not constitute a recommendation to buy or sell any stock, and does not take account of your objectives, or your financial situation. We aim to bring you long-term focused analysis driven by fundamental data. Note that our analysis may not factor in the latest price-sensitive company announcements or qualitative material. Simply Wall St has no position in any stocks mentioned.
Join A Paid User Research Session
You’ll receive a US$30 Amazon Gift card for 1 hour of your time while helping us build better investing tools for the individual investors like yourself. Sign up here