
 Yahoo Finance
 Declining Stock and Decent Financials: Is The Market Wrong About The RMR Group Inc. (NASDAQ:RMR)?
It is hard to get excited after looking at RMR Group's (NASDAQ:RMR) recent performance, when its stock has declined 20% over the past three months. However, stock prices are usually driven by a company’s financials over the long term, which in this case look pretty respectable. In this article, we decided to focus on RMR Group's ROE.
ROE or return on equity is a useful tool to assess how effectively a company can generate returns on the investment it received from its shareholders. Simply put, it is used to assess the profitability of a company in relation to its equity capital.
View our latest analysis for RMR Group
How To Calculate Return On Equity?
Return on equity can be calculated by using the formula:
Return on Equity = Net Profit (from continuing operations) ÷ Shareholders' Equity
So, based on the above formula, the ROE for RMR Group is:
25% = US$100m ÷ US$396m (Based on the trailing twelve months to March 2023).
The 'return' is the yearly profit. One way to conceptualize this is that for each $1 of shareholders' capital it has, the company made $0.25 in profit.
What Has ROE Got To Do With Earnings Growth?
So far, we've learned that ROE is a measure of a company's profitability. We now need to evaluate how much profit the company reinvests or "retains" for future growth which then gives us an idea about the growth potential of the company. Assuming all else is equal, companies that have both a higher return on equity and higher profit retention are usually the ones that have a higher growth rate when compared to companies that don't have the same features.
RMR Group's Earnings Growth And 25% ROE
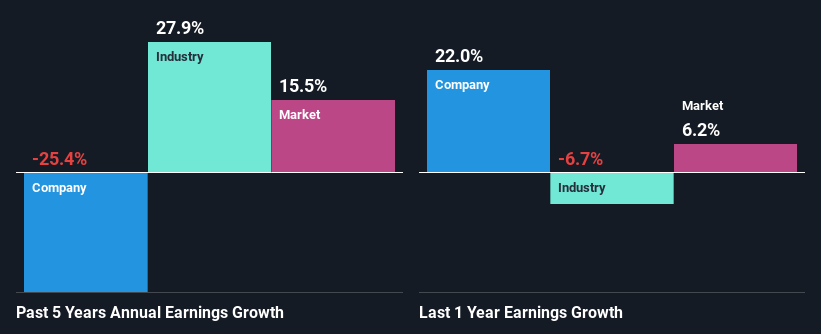
Firstly, we acknowledge that RMR Group has a significantly high ROE. Secondly, even when compared to the industry average of 9.6% the company's ROE is quite impressive. As you might expect, the 25% net income decline reported by RMR Group doesn't bode well with us. We reckon that there could be some other factors at play here that are preventing the company's growth. Such as, the company pays out a huge portion of its earnings as dividends, or is faced with competitive pressures.
However, when we compared RMR Group's growth with the industry we found that while the company's earnings have been shrinking, the industry has seen an earnings growth of 28% in the same period. This is quite worrisome.
The basis for attaching value to a company is, to a great extent, tied to its earnings growth. It’s important for an investor to know whether the market has priced in the company's expected earnings growth (or decline). By doing so, they will have an idea if the stock is headed into clear blue waters or if swampy waters await. One good indicator of expected earnings growth is the P/E ratio which determines the price the market is willing to pay for a stock based on its earnings prospects. So, you may want to check if RMR Group is trading on a high P/E or a low P/E, relative to its industry.
Is RMR Group Making Efficient Use Of Its Profits?
RMR Group has a high three-year median payout ratio of 80% (that is, it is retaining 20% of its profits). This suggests that the company is paying most of its profits as dividends to its shareholders. This goes some way in explaining why its earnings have been shrinking. With only very little left to reinvest into the business, growth in earnings is far from likely. To know the 3 risks we have identified for RMR Group visit our risks dashboard for free.
Moreover, RMR Group has been paying dividends for seven years, which is a considerable amount of time, suggesting that management must have perceived that the shareholders prefer consistent dividends even though earnings have been shrinking. Based on the latest analysts' estimates, we found that the company's future payout ratio over the next three years is expected to hold steady at 74%.
Conclusion
On the whole, we do feel that RMR Group has some positive attributes. However, while the company does have a high ROE, its earnings growth number is quite disappointing. This can be blamed on the fact that it reinvests only a small portion of its profits and pays out the rest as dividends. With that said, we studied current analyst estimates and discovered that analysts expect the company's earnings growth to improve slightly. Sure enough, this could bring some relief to shareholders. Are these analysts expectations based on the broad expectations for the industry, or on the company's fundamentals? Click here to be taken to our analyst's forecasts page for the company.
Have feedback on this article? Concerned about the content? Get in touch with us directly. Alternatively, email editorial-team (at) simplywallst.com.
This article by Simply Wall St is general in nature. We provide commentary based on historical data and analyst forecasts only using an unbiased methodology and our articles are not intended to be financial advice. It does not constitute a recommendation to buy or sell any stock, and does not take account of your objectives, or your financial situation. We aim to bring you long-term focused analysis driven by fundamental data. Note that our analysis may not factor in the latest price-sensitive company announcements or qualitative material. Simply Wall St has no position in any stocks mentioned.
Join A Paid User Research Session
You’ll receive a US$30 Amazon Gift card for 1 hour of your time while helping us build better investing tools for the individual investors like yourself. Sign up here
