
 Yahoo Finance
 Is Cub Energy Inc.'s (CVE:KUB) CEO Salary Justified?

Mikhail Afendikov became the CEO of Cub Energy Inc. (CVE:KUB) in 2011. This analysis aims first to contrast CEO compensation with other companies that have similar market capitalization. Next, we'll consider growth that the business demonstrates. And finally - as a second measure of performance - we will look at the returns shareholders have received over the last few years. The aim of all this is to consider the appropriateness of CEO pay levels.
Check out our latest analysis for Cub Energy
How Does Mikhail Afendikov's Compensation Compare With Similar Sized Companies?
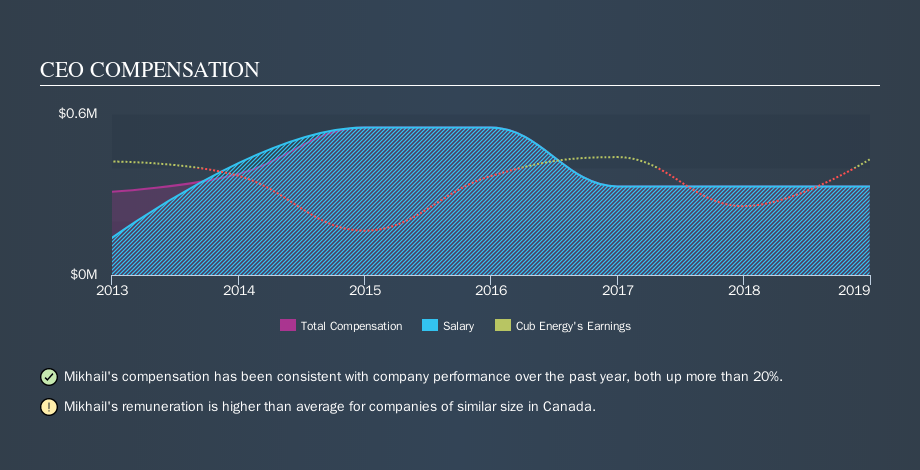
Our data indicates that Cub Energy Inc. is worth CA$28m, and total annual CEO compensation was reported as US$330k for the year to December 2018. Notably, the salary of US$330k is the vast majority of the CEO compensation. We looked at a group of companies with market capitalizations under US$200m, and the median CEO total compensation was US$121k.
It would therefore appear that Cub Energy Inc. pays Mikhail Afendikov more than the median CEO remuneration at companies of a similar size, in the same market. However, this fact alone doesn't mean the remuneration is too high. We can get a better idea of how generous the pay is by looking at the performance of the underlying business.
You can see a visual representation of the CEO compensation at Cub Energy, below.
Is Cub Energy Inc. Growing?
Over the last three years Cub Energy Inc. has shrunk its earnings per share by an average of 53% per year (measured with a line of best fit). It achieved revenue growth of 14% over the last year.
Unfortunately, earnings per share have trended lower over the last three years. While the revenue growth is good to see, it is outweighed by the fact that earnings per share are down, over three years. So given this relatively weak performance, shareholders would probably not want to see high compensation for the CEO. Although we don't have analyst forecasts shareholders might want to examine this detailed historical graph of earnings, revenue and cash flow.
Has Cub Energy Inc. Been A Good Investment?
Most shareholders would probably be pleased with Cub Energy Inc. for providing a total return of 350% over three years. This strong performance might mean some shareholders don't mind if the CEO were to be paid more than is normal for a company of its size.
In Summary...
We compared the total CEO remuneration paid by Cub Energy Inc., and compared it to remuneration at a group of similar sized companies. Our data suggests that it pays above the median CEO pay within that group.
Earnings per share have not grown in three years, and the revenue growth fails to impress us. But clearly there are some positives, because investors have done well over the same time frame. Given this situation we doubt shareholders are particularly concerned about the CEO compensation. CEO compensation is one thing, but it is also interesting to check if the CEO is buying or selling Cub Energy (free visualization of insider trades).
Of course, you might find a fantastic investment by looking elsewhere. So take a peek at this free list of interesting companies.
We aim to bring you long-term focused research analysis driven by fundamental data. Note that our analysis may not factor in the latest price-sensitive company announcements or qualitative material.
If you spot an error that warrants correction, please contact the editor at editorial-team@simplywallst.com. This article by Simply Wall St is general in nature. It does not constitute a recommendation to buy or sell any stock, and does not take account of your objectives, or your financial situation. Simply Wall St has no position in the stocks mentioned. Thank you for reading.