
 Yahoo Finance
 Crude Oil Price Update – Strengthens Over $56.95, Weakens Under $55.72
U.S. West Texas Intermediate crude oil futures are trading higher on Wednesday following the release of an industry report that showed a larger-than-expected drop in U.S. crude inventories. However, lingering concerns over lower demand due to a possible global recession continued to put a lid on gains. Later today, investors will get the opportunity to react to the U.S. Energy Information Administration’s weekly inventories report. Traders will also be eyeing the Fed minutes to see if the central bank has a plan to aggressively defend the U.S. from a possible recession.
At 06:46 GMT, October WTI crude oil futures are trading $56.31, up $0.18 or +0.32%.
Daily Swing Chart Technical Analysis
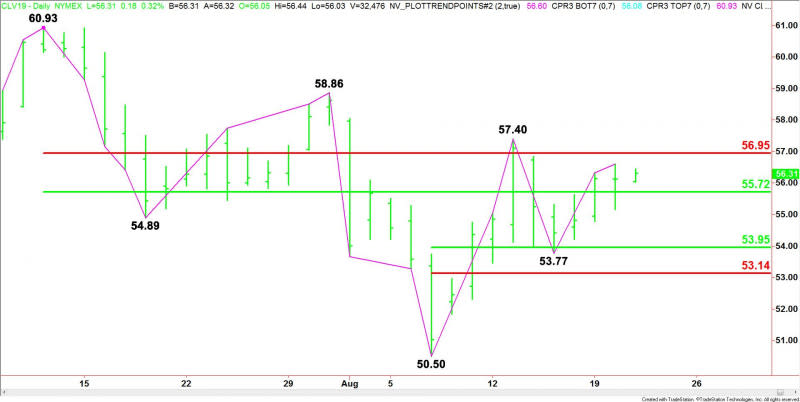
The main trend is down according to the daily swing chart. A trade through $57.40 will change the main trend to up. A move through $53.77 will signal a resumption of the downtrend.
The main range is $60.93 to $50.50. Its retracement zone at $55.72 to $56.95 is controlling the near-term direction of the market. It is currently trading inside this zone.
The short-term range is $50.50 to $57.50. Its retracement zone at $53.95 to $53.14 is potential support. It stopped the selling on August 15 at $53.77.
Daily Swing Chart Technical Forecast
Based on the price action the past two sessions and today’s current price at $56.31, the direction of the October WTI crude oil futures contract on Wednesday is likely to be determined by trader reaction to the main 50% level at $55.72.
Bullish Scenario
A sustained move over $55.72 will indicate the presence of buyers. If this move creates enough upside momentum then look for a rally into the main Fibonacci level at $56.95. We could see sellers on the first test of this level. Overcoming it, however, should lead to a test of the main top at $57.40.
Taking out $57.40 will change the main trend to up. This could trigger an acceleration to the upside with $58.86 the next potential target.
Bearish Scenario
A sustained move under $55.72 will signal the presence of sellers. This could trigger the start of a steep break since the next support doesn’t come in until $53.95, followed closely by the main bottom at $53.77.
This article was originally posted on FX Empire
