
 Yahoo Finance
 Crude Oil Price Update – September WTI Trend Changes to Down on Trade Through $69.93
Crude oil futures are trading lower on supply concerns after the Trump administration announced it would consider exemptions from adhering to the sanctions on Iran. The news came as a bit of a shock to crude oil bulls because just recently, the administration said there would be zero tolerance to adherence to the sanctions and that any country who violated the order would face serious financial penalties.
At 1155 GMT, September West Texas Intermediate crude oil futures are trading $71.76, down $0.80 or -1.10%.
Daily Technical Analysis
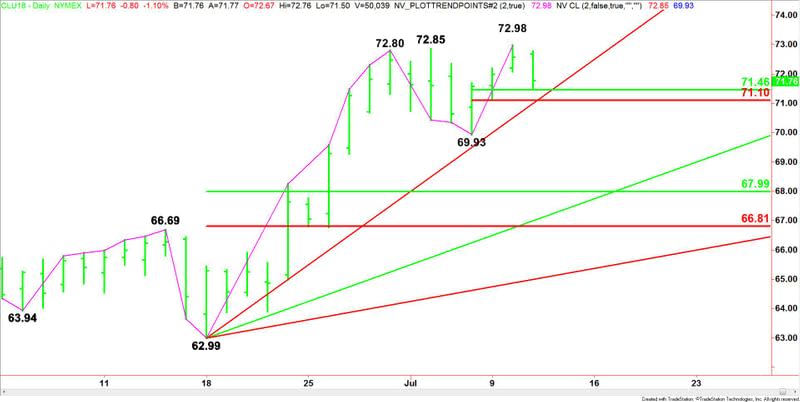
The main trend is up according to the daily swing chart. It was reaffirmed on Tuesday when buyers took out the previous main top at $72.85. The trend will change to down on a move through $69.93.
The short-term range is $69.93 to $72.98. Its retracement zone at $71.46 to $71.10 is the first downside target.
The main range is $62.99 to $72.98. If the trend changes to down then its retracement zone at $67.99 to $66.81 will become the next downside target.
Suggested Articles
Markets Shunted into Risk Aversion as US President Looks to Add $200B in Tariffs Against China
Erdogan’s Biggest War is Inflation: The Turkish Lira in a Free Fall
Daily Technical Forecast
Based on the early price action, the direction of the September WTI crude oil futures contract is likely to be determined by trader reaction to the 50% level at $71.46.
A sustained move over $71.46 will indicate the presence of buyers. If this attracts enough upside momentum, we could see a retest of $72.98.
A sustained move under $71.46 will signal the presence of sellers. This could lead to a quick move into the short-term Fibonacci level at $71.10. This is followed closely by the steep uptrending Gann angle at $70.99.
The angle at $70.99 is the trigger point for an acceleration to the downside. This could lead to a test of the main bottom at $69.93.
If $69.93 fails, the trend will change to down. This could fuel another steep break with the next downside target the major 50% level at $67.99.
Basically, look for an upside bias to develop if buyers can hold the market above $71.46. Look for the start of a steep sell-off if sellers take out $70.00 with conviction.
This article was originally posted on FX Empire
