
 Yahoo Finance
 CRA International (NASDAQ:CRAI) Might Have The Makings Of A Multi-Bagger
If you're not sure where to start when looking for the next multi-bagger, there are a few key trends you should keep an eye out for. Ideally, a business will show two trends; firstly a growing return on capital employed (ROCE) and secondly, an increasing amount of capital employed. Basically this means that a company has profitable initiatives that it can continue to reinvest in, which is a trait of a compounding machine. So on that note, CRA International (NASDAQ:CRAI) looks quite promising in regards to its trends of return on capital.
Understanding Return On Capital Employed (ROCE)
Just to clarify if you're unsure, ROCE is a metric for evaluating how much pre-tax income (in percentage terms) a company earns on the capital invested in its business. The formula for this calculation on CRA International is:
Return on Capital Employed = Earnings Before Interest and Tax (EBIT) ÷ (Total Assets - Current Liabilities)
0.18 = US$58m ÷ (US$554m - US$231m) (Based on the trailing twelve months to October 2022).
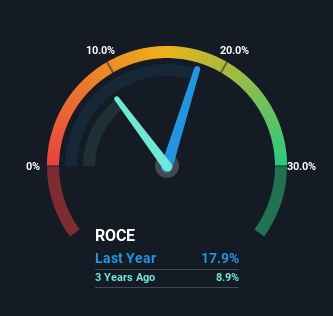
Therefore, CRA International has an ROCE of 18%. On its own, that's a standard return, however it's much better than the 13% generated by the Professional Services industry.
See our latest analysis for CRA International
In the above chart we have measured CRA International's prior ROCE against its prior performance, but the future is arguably more important. If you'd like, you can check out the forecasts from the analysts covering CRA International here for free.
What The Trend Of ROCE Can Tell Us
We like the trends that we're seeing from CRA International. The numbers show that in the last five years, the returns generated on capital employed have grown considerably to 18%. The amount of capital employed has increased too, by 36%. This can indicate that there's plenty of opportunities to invest capital internally and at ever higher rates, a combination that's common among multi-baggers.
For the record though, there was a noticeable increase in the company's current liabilities over the period, so we would attribute some of the ROCE growth to that. Effectively this means that suppliers or short-term creditors are now funding 42% of the business, which is more than it was five years ago. And with current liabilities at those levels, that's pretty high.
Our Take On CRA International's ROCE
All in all, it's terrific to see that CRA International is reaping the rewards from prior investments and is growing its capital base. Since the stock has returned a staggering 189% to shareholders over the last five years, it looks like investors are recognizing these changes. Therefore, we think it would be worth your time to check if these trends are going to continue.
On a final note, we've found 1 warning sign for CRA International that we think you should be aware of.
While CRA International may not currently earn the highest returns, we've compiled a list of companies that currently earn more than 25% return on equity. Check out this free list here.
Have feedback on this article? Concerned about the content? Get in touch with us directly. Alternatively, email editorial-team (at) simplywallst.com.
This article by Simply Wall St is general in nature. We provide commentary based on historical data and analyst forecasts only using an unbiased methodology and our articles are not intended to be financial advice. It does not constitute a recommendation to buy or sell any stock, and does not take account of your objectives, or your financial situation. We aim to bring you long-term focused analysis driven by fundamental data. Note that our analysis may not factor in the latest price-sensitive company announcements or qualitative material. Simply Wall St has no position in any stocks mentioned.
Join A Paid User Research Session
You’ll receive a US$30 Amazon Gift card for 1 hour of your time while helping us build better investing tools for the individual investors like yourself. Sign up here
