
 Yahoo Finance
 Could The Fortis Inc. (TSE:FTS) Ownership Structure Tell Us Something Useful?

Want to participate in a short research study? Help shape the future of investing tools and you could win a $250 gift card!
A look at the shareholders of Fortis Inc. (TSE:FTS) can tell us which group is most powerful. Generally speaking, as a company grows, institutions will increase their ownership. Conversely, insiders often decrease their ownership over time. We also tend to see lower insider ownership in companies that were previously publicly owned.
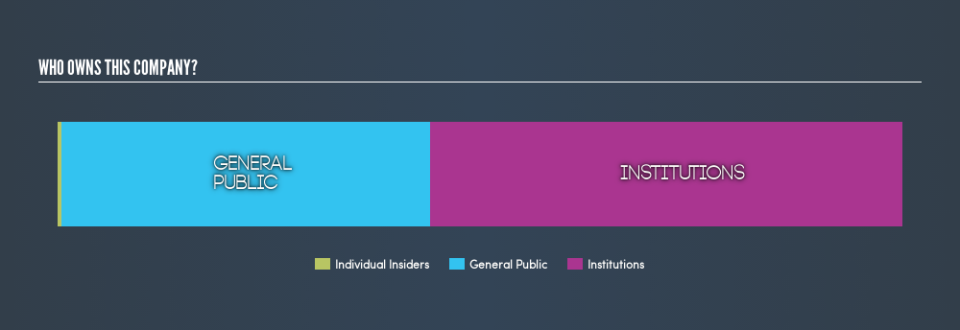
Fortis has a market capitalization of CA$23b, so it's too big to fly under the radar. We'd expect to see both institutions and retail investors owning a portion of the company. Taking a look at our data on the ownership groups (below), it's seems that institutions are noticeable on the share registry. Let's take a closer look to see what the different types of shareholder can tell us about FTS.
Check out our latest analysis for Fortis
What Does The Institutional Ownership Tell Us About Fortis?
Many institutions measure their performance against an index that approximates the local market. So they usually pay more attention to companies that are included in major indices.
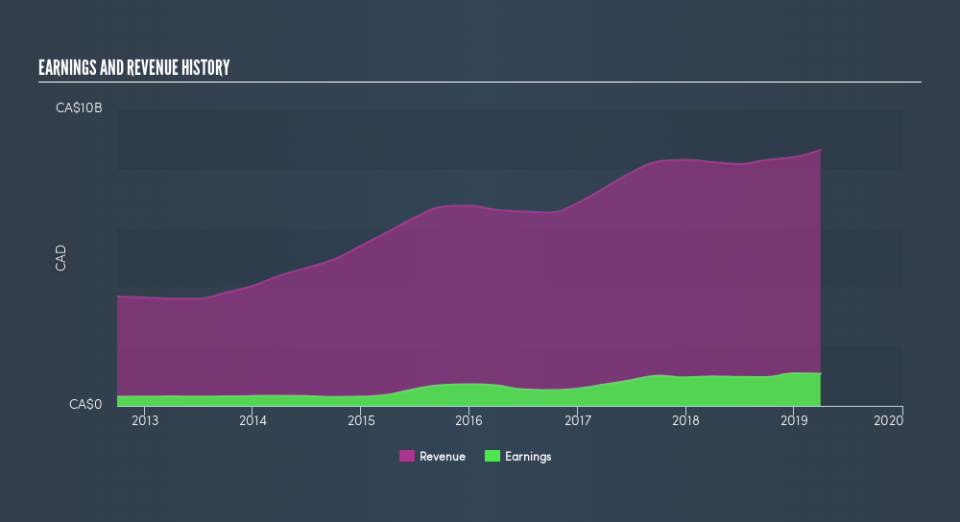
Fortis already has institutions on the share registry. Indeed, they own 56% of the company. This implies the analysts working for those institutions have looked at the stock and they like it. But just like anyone else, they could be wrong. When multiple institutions own a stock, there's always a risk that they are in a 'crowded trade'. When such a trade goes wrong, multiple parties may compete to sell stock fast. This risk is higher in a company without a history of growth. You can see Fortis's historic earnings and revenue, below, but keep in mind there's always more to the story.
Institutional investors own over 50% of the company, so together than can probably strongly influence board decisions. Fortis is not owned by hedge funds. There are plenty of analysts covering the stock, so it might be worth seeing what they are forecasting, too.
Insider Ownership Of Fortis
While the precise definition of an insider can be subjective, almost everyone considers board members to be insiders. The company management answer to the board; and the latter should represent the interests of shareholders. Notably, sometimes top-level managers are on the board, themselves.
I generally consider insider ownership to be a good thing. However, on some occasions it makes it more difficult for other shareholders to hold the board accountable for decisions.
Our data suggests that insiders own under 1% of Fortis Inc. in their own names. Being so large, we would not expect insiders to own a large proportion of the stock. Collectively, they own CA$125m of stock. In this sort of situation, it can be more interesting to see if those insiders have been buying or selling.
General Public Ownership
The general public, with a 44% stake in the company, will not easily be ignored. While this group can't necessarily call the shots, it can certainly have a real influence on how the company is run.
Next Steps:
While it is well worth considering the different groups that own a company, there are other factors that are even more important.
I always like to check for a history of revenue growth. You can too, by accessing this free chart of historic revenue and earnings in this detailed graph.
If you would prefer discover what analysts are predicting in terms of future growth, do not miss this free report on analyst forecasts.
NB: Figures in this article are calculated using data from the last twelve months, which refer to the 12-month period ending on the last date of the month the financial statement is dated. This may not be consistent with full year annual report figures.
We aim to bring you long-term focused research analysis driven by fundamental data. Note that our analysis may not factor in the latest price-sensitive company announcements or qualitative material.
If you spot an error that warrants correction, please contact the editor at editorial-team@simplywallst.com. This article by Simply Wall St is general in nature. It does not constitute a recommendation to buy or sell any stock, and does not take account of your objectives, or your financial situation. Simply Wall St has no position in the stocks mentioned. Thank you for reading.
