
 Yahoo Finance
 Is Corus Entertainment Inc. (TSE:CJR.B) Investing Effectively In Its Business?

Today we are going to look at Corus Entertainment Inc. (TSE:CJR.B) to see whether it might be an attractive investment prospect. In particular, we'll consider its Return On Capital Employed (ROCE), as that can give us insight into how profitably the company is able to employ capital in its business.
First up, we'll look at what ROCE is and how we calculate it. Then we'll compare its ROCE to similar companies. And finally, we'll look at how its current liabilities are impacting its ROCE.
What is Return On Capital Employed (ROCE)?
ROCE measures the amount of pre-tax profits a company can generate from the capital employed in its business. In general, businesses with a higher ROCE are usually better quality. In brief, it is a useful tool, but it is not without drawbacks. Author Edwin Whiting says to be careful when comparing the ROCE of different businesses, since 'No two businesses are exactly alike.
How Do You Calculate Return On Capital Employed?
Analysts use this formula to calculate return on capital employed:
Return on Capital Employed = Earnings Before Interest and Tax (EBIT) ÷ (Total Assets - Current Liabilities)
Or for Corus Entertainment:
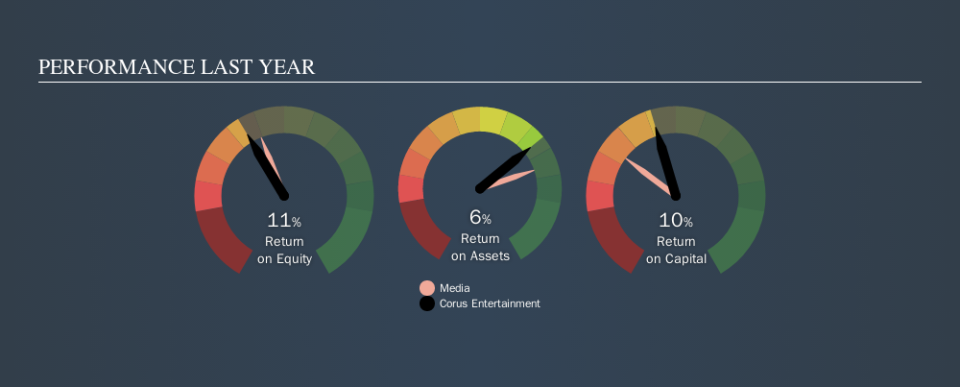
0.10 = CA$425m ÷ (CA$4.8b - CA$560m) (Based on the trailing twelve months to May 2019.)
Therefore, Corus Entertainment has an ROCE of 10%.
Check out our latest analysis for Corus Entertainment
Is Corus Entertainment's ROCE Good?
One way to assess ROCE is to compare similar companies. Using our data, Corus Entertainment's ROCE appears to be around the 9.2% average of the Media industry. Regardless of where Corus Entertainment sits next to its industry, its ROCE in absolute terms appears satisfactory, and this company could be worth a closer look.
Our data shows that Corus Entertainment currently has an ROCE of 10%, compared to its ROCE of 5.6% 3 years ago. This makes us wonder if the company is improving. You can see in the image below how Corus Entertainment's ROCE compares to its industry. Click to see more on past growth.
Remember that this metric is backwards looking - it shows what has happened in the past, and does not accurately predict the future. Companies in cyclical industries can be difficult to understand using ROCE, as returns typically look high during boom times, and low during busts. ROCE is, after all, simply a snap shot of a single year. What happens in the future is pretty important for investors, so we have prepared a free report on analyst forecasts for Corus Entertainment.
How Corus Entertainment's Current Liabilities Impact Its ROCE
Current liabilities include invoices, such as supplier payments, short-term debt, or a tax bill, that need to be paid within 12 months. Due to the way ROCE is calculated, a high level of current liabilities makes a company look as though it has less capital employed, and thus can (sometimes unfairly) boost the ROCE. To check the impact of this, we calculate if a company has high current liabilities relative to its total assets.
Corus Entertainment has total assets of CA$4.8b and current liabilities of CA$560m. Therefore its current liabilities are equivalent to approximately 12% of its total assets. Low current liabilities are not boosting the ROCE too much.
What We Can Learn From Corus Entertainment's ROCE
With that in mind, Corus Entertainment's ROCE appears pretty good. There might be better investments than Corus Entertainment out there, but you will have to work hard to find them . These promising businesses with rapidly growing earnings might be right up your alley.
If you are like me, then you will not want to miss this free list of growing companies that insiders are buying.
We aim to bring you long-term focused research analysis driven by fundamental data. Note that our analysis may not factor in the latest price-sensitive company announcements or qualitative material.
If you spot an error that warrants correction, please contact the editor at editorial-team@simplywallst.com. This article by Simply Wall St is general in nature. It does not constitute a recommendation to buy or sell any stock, and does not take account of your objectives, or your financial situation. Simply Wall St has no position in the stocks mentioned. Thank you for reading.
