
 Yahoo Finance
 Should You Like Core Laboratories N.V.’s (NYSE:CLB) High Return On Capital Employed?

Today we are going to look at Core Laboratories N.V. (NYSE:CLB) to see whether it might be an attractive investment prospect. To be precise, we'll consider its Return On Capital Employed (ROCE), as that will inform our view of the quality of the business.
First, we'll go over how we calculate ROCE. Next, we'll compare it to others in its industry. Finally, we'll look at how its current liabilities affect its ROCE.
Return On Capital Employed (ROCE): What is it?
ROCE is a measure of a company's yearly pre-tax profit (its return), relative to the capital employed in the business. Generally speaking a higher ROCE is better. Ultimately, it is a useful but imperfect metric. Author Edwin Whiting says to be careful when comparing the ROCE of different businesses, since 'No two businesses are exactly alike.
So, How Do We Calculate ROCE?
Analysts use this formula to calculate return on capital employed:
Return on Capital Employed = Earnings Before Interest and Tax (EBIT) ÷ (Total Assets - Current Liabilities)
Or for Core Laboratories:
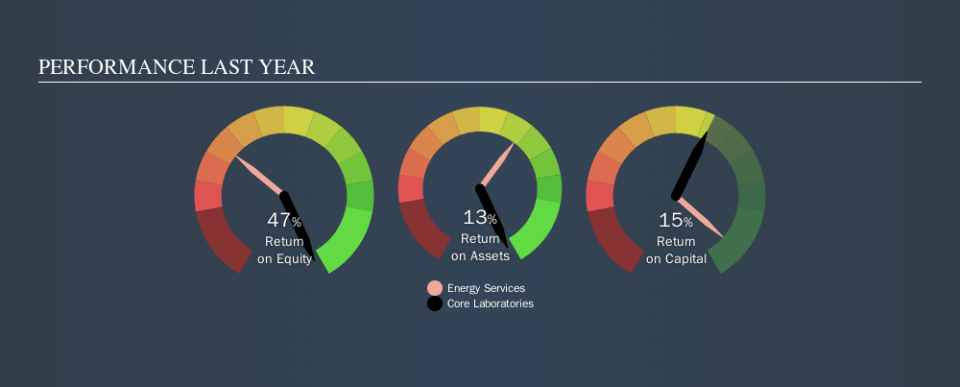
0.15 = US$99m ÷ (US$782m - US$125m) (Based on the trailing twelve months to June 2019.)
So, Core Laboratories has an ROCE of 15%.
Check out our latest analysis for Core Laboratories
Is Core Laboratories's ROCE Good?
ROCE can be useful when making comparisons, such as between similar companies. Using our data, we find that Core Laboratories's ROCE is meaningfully better than the 9.8% average in the Energy Services industry. We consider this a positive sign, because it suggests it uses capital more efficiently than similar companies. Regardless of where Core Laboratories sits next to its industry, its ROCE in absolute terms appears satisfactory, and this company could be worth a closer look.
Core Laboratories's current ROCE of 15% is lower than its ROCE in the past, which was 28%, 3 years ago. This makes us wonder if the business is facing new challenges. You can click on the image below to see (in greater detail) how Core Laboratories's past growth compares to other companies.
Remember that this metric is backwards looking - it shows what has happened in the past, and does not accurately predict the future. Companies in cyclical industries can be difficult to understand using ROCE, as returns typically look high during boom times, and low during busts. This is because ROCE only looks at one year, instead of considering returns across a whole cycle. We note Core Laboratories could be considered a cyclical business. Future performance is what matters, and you can see analyst predictions in our free report on analyst forecasts for the company.
Do Core Laboratories's Current Liabilities Skew Its ROCE?
Short term (or current) liabilities, are things like supplier invoices, overdrafts, or tax bills that need to be paid within 12 months. Due to the way ROCE is calculated, a high level of current liabilities makes a company look as though it has less capital employed, and thus can (sometimes unfairly) boost the ROCE. To check the impact of this, we calculate if a company has high current liabilities relative to its total assets.
Core Laboratories has total liabilities of US$125m and total assets of US$782m. Therefore its current liabilities are equivalent to approximately 16% of its total assets. Low current liabilities are not boosting the ROCE too much.
What We Can Learn From Core Laboratories's ROCE
This is good to see, and with a sound ROCE, Core Laboratories could be worth a closer look. Core Laboratories looks strong on this analysis, but there are plenty of other companies that could be a good opportunity . Here is a free list of companies growing earnings rapidly.
Core Laboratories is not the only stock that insiders are buying. For those who like to find winning investments this free list of growing companies with recent insider purchasing, could be just the ticket.
We aim to bring you long-term focused research analysis driven by fundamental data. Note that our analysis may not factor in the latest price-sensitive company announcements or qualitative material.
If you spot an error that warrants correction, please contact the editor at editorial-team@simplywallst.com. This article by Simply Wall St is general in nature. It does not constitute a recommendation to buy or sell any stock, and does not take account of your objectives, or your financial situation. Simply Wall St has no position in the stocks mentioned. Thank you for reading.
