
 Yahoo Finance
 Here’s What Constellation Software Inc’s (TSE:CSU) P/E Is Telling Us

This article is for investors who would like to improve their understanding of price to earnings ratios (P/E ratios). We’ll look at Constellation Software Inc’s (TSE:CSU) P/E ratio and reflect on what it tells us about the company’s share price. Based on the last twelve months, Constellation Software’s P/E ratio is 54.06. That corresponds to an earnings yield of approximately 1.8%.
See our latest analysis for Constellation Software
How Do You Calculate Constellation Software’s P/E Ratio?
The formula for P/E is:
Price to Earnings Ratio = Share Price (in reporting currency) ÷ Earnings per Share (EPS)
Or for Constellation Software:
P/E of 54.06 = $705.02 (Note: this is the share price in the reporting currency, namely, USD ) ÷ $13.04 (Based on the trailing twelve months to September 2018.)
Is A High P/E Ratio Good?
A higher P/E ratio implies that investors pay a higher price for the earning power of the business. All else being equal, it’s better to pay a low price — but as Warren Buffett said, ‘It’s far better to buy a wonderful company at a fair price than a fair company at a wonderful price.’
How Growth Rates Impact P/E Ratios
Probably the most important factor in determining what P/E a company trades on is the earnings growth. Earnings growth means that in the future the ‘E’ will be higher. Therefore, even if you pay a high multiple of earnings now, that multiple will become lower in the future. So while a stock may look expensive based on past earnings, it could be cheap based on future earnings.
Notably, Constellation Software grew EPS by a whopping 31% in the last year. And it has bolstered its earnings per share by 23% per year over the last five years. I’d therefore be a little surprised if its P/E ratio was not relatively high.
How Does Constellation Software’s P/E Ratio Compare To Its Peers?
The P/E ratio indicates whether the market has higher or lower expectations of a company. The image below shows that Constellation Software has a higher P/E than the average (46.6) P/E for companies in the software industry.
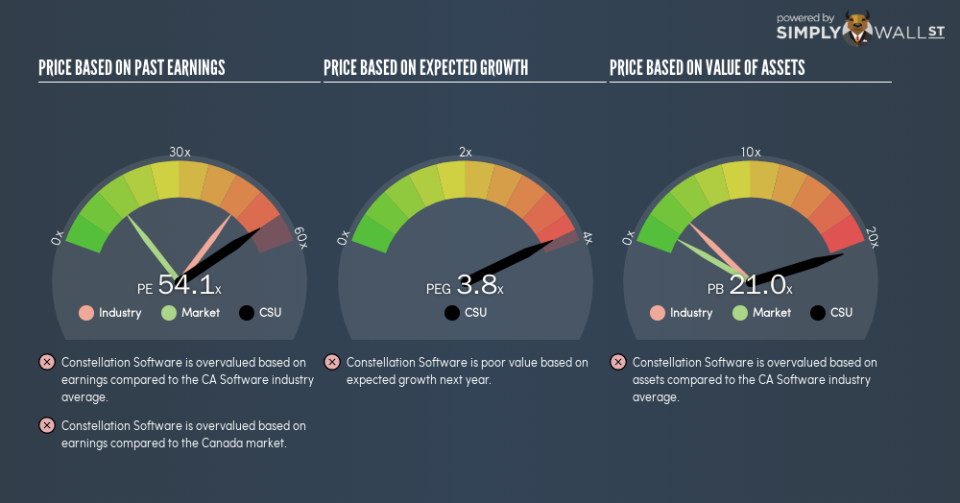
That means that the market expects Constellation Software will outperform other companies in its industry. Shareholders are clearly optimistic, but the future is always uncertain. So further research is always essential. I often monitor director buying and selling.
A Limitation: P/E Ratios Ignore Debt and Cash In The Bank
Don’t forget that the P/E ratio considers market capitalization. That means it doesn’t take debt or cash into account. Theoretically, a business can improve its earnings (and produce a lower P/E in the future), by taking on debt (or spending its remaining cash).
Such spending might be good or bad, overall, but the key point here is that you need to look at debt to understand the P/E ratio in context.
Is Debt Impacting Constellation Software’s P/E?
The extra options and safety that comes with Constellation Software’s US$57m net cash position means that it deserves a higher P/E than it would if it had a lot of net debt.
The Bottom Line On Constellation Software’s P/E Ratio
Constellation Software has a P/E of 54.1. That’s significantly higher than the average in the CA market, which is 13.7. Its strong balance sheet gives the company plenty of resources for extra growth, and it has already proven it can grow. So it is not surprising the market is probably extrapolating recent growth well into the future, reflected in the relatively high P/E ratio.
Investors have an opportunity when market expectations about a stock are wrong. As value investor Benjamin Graham famously said, ‘In the short run, the market is a voting machine but in the long run, it is a weighing machine.’ So this free visual report on analyst forecasts could hold they key to an excellent investment decision.
But note: Constellation Software may not be the best stock to buy. So take a peek at this free list of interesting companies with strong recent earnings growth (and a P/E ratio below 20).
To help readers see past the short term volatility of the financial market, we aim to bring you a long-term focused research analysis purely driven by fundamental data. Note that our analysis does not factor in the latest price-sensitive company announcements.
The author is an independent contributor and at the time of publication had no position in the stocks mentioned. For errors that warrant correction please contact the editor at editorial-team@simplywallst.com.
