
 Yahoo Finance
 Should You Be Concerned About Enerflex Ltd.’s (TSE:EFX) Historical Volatility?

If you own shares in Enerflex Ltd. (TSE:EFX) then it’s worth thinking about how it contributes to the volatility of your portfolio, overall. In finance, Beta is a measure of volatility. Modern finance theory considers volatility to be a measure of risk, and there are two main types of price volatility. The first category is company specific volatility. This can be dealt with by limiting your exposure to any particular stock. The second type is the broader market volatility, which you cannot diversify away, since it arises from macroeconomic factors which directly affects all the stocks on the market.
Some stocks are more sensitive to general market forces than others. Beta is a widely used metric to measure a stock’s exposure to market risk (volatility). Before we go on, it’s worth noting that Warren Buffett pointed out in his 2014 letter to shareholders that ‘volatility is far from synonymous with risk.’ Having said that, beta can still be rather useful. The first thing to understand about beta is that the beta of the overall market is one. Any stock with a beta of greater than one is considered more volatile than the market, while those with a beta below one are either less volatile or poorly correlated with the market.
See our latest analysis for Enerflex
What does EFX’s beta value mean to investors?
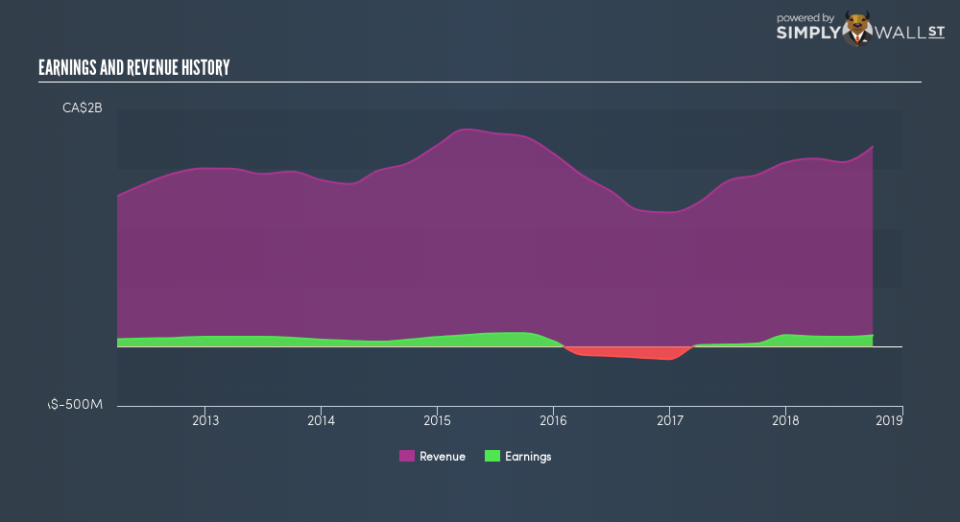
Given that it has a beta of 1.15, we can surmise that the Enerflex share price has been fairly sensitive to market volatility (over the last 5 years). Based on this history, investors should be aware that Enerflex are likely to rise strongly in times of greed, but sell off in times of fear. Many would argue that beta is useful in position sizing, but fundamental metrics such as revenue and earnings are more important overall. You can see Enerflex’s revenue and earnings in the image below.
How does EFX’s size impact its beta?
Enerflex is a small company, but not tiny and little known. It has a market capitalisation of CA$1.5b, which means it would be on the radar of intstitutional investors. It’s not particularly surprising that it has a higher beta than the overall market. That’s because it takes less money to influence the share price of a smaller company, than a bigger company.
What this means for you:
Beta only tells us that the Enerflex share price is sensitive to broader market movements. This could indicate that it is a high growth company, or is heavily influenced by sentiment because it is speculative. Alternatively, it could have operating leverage in its business model. Ultimately, beta is an interesting metric, but there’s plenty more to learn. This article aims to educate investors about beta values, but it’s well worth looking at important company-specific fundamentals such as Enerflex’s financial health and performance track record. I highly recommend you dive deeper by considering the following:
Future Outlook: What are well-informed industry analysts predicting for EFX’s future growth? Take a look at our free research report of analyst consensus for EFX’s outlook.
Past Track Record: Has EFX been consistently performing well irrespective of the ups and downs in the market? Go into more detail in the past performance analysis and take a look at the free visual representations of EFX’s historicals for more clarity.
Other Interesting Stocks: It’s worth checking to see how EFX measures up against other companies on valuation. You could start with this free list of prospective options.
To help readers see past the short term volatility of the financial market, we aim to bring you a long-term focused research analysis purely driven by fundamental data. Note that our analysis does not factor in the latest price-sensitive company announcements.
The author is an independent contributor and at the time of publication had no position in the stocks mentioned. For errors that warrant correction please contact the editor at editorial-team@simplywallst.com.
