
 Yahoo Finance
 Should You Be Concerned About AcuityAds Holdings Inc.’s (CVE:AT) Historical Volatility?

Anyone researching AcuityAds Holdings Inc. (CVE:AT) might want to consider the historical volatility of the share price. Volatility is considered to be a measure of risk in modern finance theory. Investors may think of volatility as falling into two main categories. The first type is company specific volatility. Investors use diversification across uncorrelated stocks to reduce this kind of price volatility across the portfolio. The second sort is caused by the natural volatility of markets, overall. For example, certain macroeconomic events will impact (virtually) all stocks on the market.
Some stocks are more sensitive to general market forces than others. Beta can be a useful tool to understand how much a stock is influenced by market risk (volatility). However, Warren Buffett said ‘volatility is far from synonymous with risk’ in his 2014 letter to investors. So, while useful, beta is not the only metric to consider. To use beta as an investor, you must first understand that the overall market has a beta of one. A stock with a beta greater than one is more sensitive to broader market movements than a stock with a beta of less than one.
See our latest analysis for AcuityAds Holdings
What we can learn from AT’s beta value
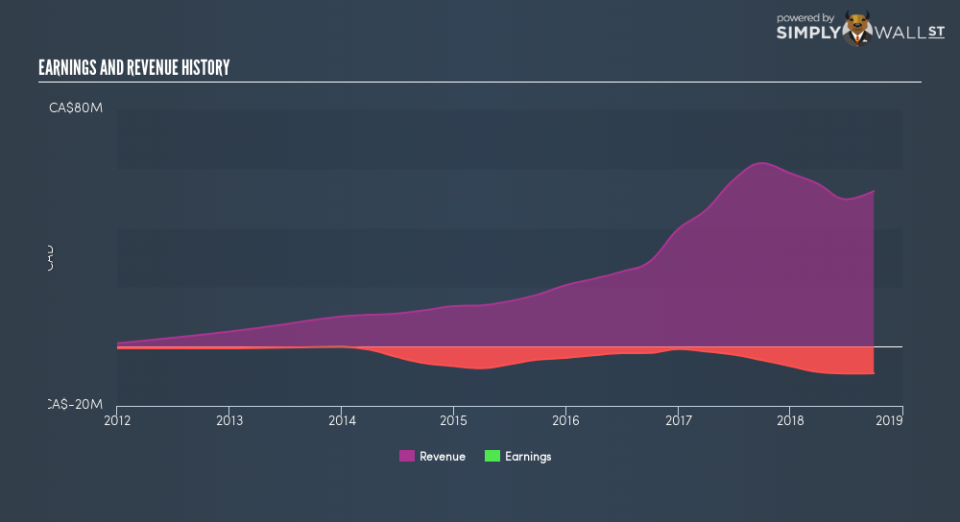
Looking at the last five years, AcuityAds Holdings has a beta of 1.97. The fact that this is well above 1 indicates that its share price movements have shown sensitivity to overall market volatility. If this beta value holds true in the future, AcuityAds Holdings shares are likely to rise more than the market when the market is going up, but fall faster when the market is going down. Beta is worth considering, but it’s also important to consider whether AcuityAds Holdings is growing earnings and revenue. You can take a look for yourself, below.
Does AT’s size influence the expected beta?
AcuityAds Holdings is a rather small company. It has a market capitalisation of CA$46m, which means it is probably under the radar of most investors. Relatively few investors can influence the price of a smaller company, compared to a large company. This could explain the high beta value, in this case.
What this means for you:
Beta only tells us that the AcuityAds Holdings share price is sensitive to broader market movements. This could indicate that it is a high growth company, or is heavily influenced by sentiment because it is speculative. Alternatively, it could have operating leverage in its business model. Ultimately, beta is an interesting metric, but there’s plenty more to learn. This article aims to educate investors about beta values, but it’s well worth looking at important company-specific fundamentals such as AcuityAds Holdings’s financial health and performance track record. I highly recommend you dive deeper by considering the following:
Future Outlook: What are well-informed industry analysts predicting for AT’s future growth? Take a look at our free research report of analyst consensus for AT’s outlook.
Past Track Record: Has AT been consistently performing well irrespective of the ups and downs in the market? Go into more detail in the past performance analysis and take a look at the free visual representations of AT’s historicals for more clarity.
Other Interesting Stocks: It’s worth checking to see how AT measures up against other companies on valuation. You could start with this free list of prospective options.
To help readers see past the short term volatility of the financial market, we aim to bring you a long-term focused research analysis purely driven by fundamental data. Note that our analysis does not factor in the latest price-sensitive company announcements.
The author is an independent contributor and at the time of publication had no position in the stocks mentioned. For errors that warrant correction please contact the editor at editorial-team@simplywallst.com.
