
 Yahoo Finance
 Computer Modelling Group (TSE:CMG) shareholders have earned a 17% CAGR over the last three years
Buying a low-cost index fund will get you the average market return. But if you invest in individual stocks, some are likely to underperform. Unfortunately for shareholders, while the Computer Modelling Group Ltd. (TSE:CMG) share price is up 44% in the last three years, that falls short of the market return. Some buyers are laughing, though, with an increase of 31% in the last year.
Now it's worth having a look at the company's fundamentals too, because that will help us determine if the long term shareholder return has matched the performance of the underlying business.
Check out our latest analysis for Computer Modelling Group
There is no denying that markets are sometimes efficient, but prices do not always reflect underlying business performance. By comparing earnings per share (EPS) and share price changes over time, we can get a feel for how investor attitudes to a company have morphed over time.
Over the last three years, Computer Modelling Group failed to grow earnings per share, which fell 4.6% (annualized).
Given the share price resilience, we don't think the (declining) EPS numbers are a good measure of how the business is moving forward, right now. So other metrics may hold the key to understanding what is influencing investors.
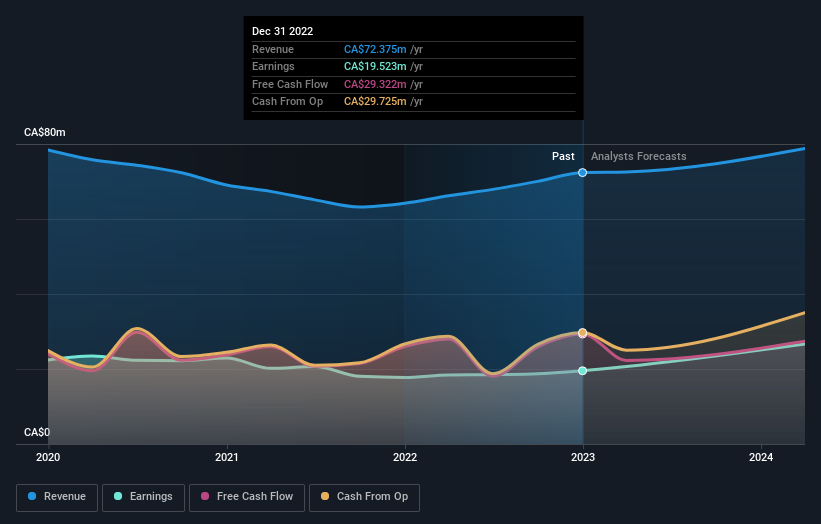
The revenue drop of 3.9% is as underwhelming as some politicians. What's clear is that historic earnings and revenue aren't matching up with the share price action, very well. So you might have to dig deeper to get a grasp of the situation
You can see below how earnings and revenue have changed over time (discover the exact values by clicking on the image).
Take a more thorough look at Computer Modelling Group's financial health with this free report on its balance sheet.
What About Dividends?
As well as measuring the share price return, investors should also consider the total shareholder return (TSR). Whereas the share price return only reflects the change in the share price, the TSR includes the value of dividends (assuming they were reinvested) and the benefit of any discounted capital raising or spin-off. It's fair to say that the TSR gives a more complete picture for stocks that pay a dividend. We note that for Computer Modelling Group the TSR over the last 3 years was 62%, which is better than the share price return mentioned above. This is largely a result of its dividend payments!
A Different Perspective
We're pleased to report that Computer Modelling Group shareholders have received a total shareholder return of 36% over one year. And that does include the dividend. Notably the five-year annualised TSR loss of 1.0% per year compares very unfavourably with the recent share price performance. We generally put more weight on the long term performance over the short term, but the recent improvement could hint at a (positive) inflection point within the business. It's always interesting to track share price performance over the longer term. But to understand Computer Modelling Group better, we need to consider many other factors. For instance, we've identified 2 warning signs for Computer Modelling Group that you should be aware of.
But note: Computer Modelling Group may not be the best stock to buy. So take a peek at this free list of interesting companies with past earnings growth (and further growth forecast).
Please note, the market returns quoted in this article reflect the market weighted average returns of stocks that currently trade on Canadian exchanges.
Have feedback on this article? Concerned about the content? Get in touch with us directly. Alternatively, email editorial-team (at) simplywallst.com.
This article by Simply Wall St is general in nature. We provide commentary based on historical data and analyst forecasts only using an unbiased methodology and our articles are not intended to be financial advice. It does not constitute a recommendation to buy or sell any stock, and does not take account of your objectives, or your financial situation. We aim to bring you long-term focused analysis driven by fundamental data. Note that our analysis may not factor in the latest price-sensitive company announcements or qualitative material. Simply Wall St has no position in any stocks mentioned.
Join A Paid User Research Session
You’ll receive a US$30 Amazon Gift card for 1 hour of your time while helping us build better investing tools for the individual investors like yourself. Sign up here
