
 Yahoo Finance
 How Computer Modelling Group Ltd. (TSE:CMG) Can Impact Your Portfolio Volatility

Anyone researching Computer Modelling Group Ltd. (TSE:CMG) might want to consider the historical volatility of the share price. Volatility is considered to be a measure of risk in modern finance theory. Investors may think of volatility as falling into two main categories. The first type is company specific volatility. Investors use diversification across uncorrelated stocks to reduce this kind of price volatility across the portfolio. The second sort is caused by the natural volatility of markets, overall. For example, certain macroeconomic events will impact (virtually) all stocks on the market.
Some stocks see their prices move in concert with the market. Others tend towards stronger, gentler or unrelated price movements. Beta can be a useful tool to understand how much a stock is influenced by market risk (volatility). However, Warren Buffett said 'volatility is far from synonymous with risk' in his 2014 letter to investors. So, while useful, beta is not the only metric to consider. To use beta as an investor, you must first understand that the overall market has a beta of one. A stock with a beta below one is either less volatile than the market, or more volatile but not corellated with the overall market. In comparison a stock with a beta of over one tends to be move in a similar direction to the market in the long term, but with greater changes in price.
See our latest analysis for Computer Modelling Group
What we can learn from CMG's beta value
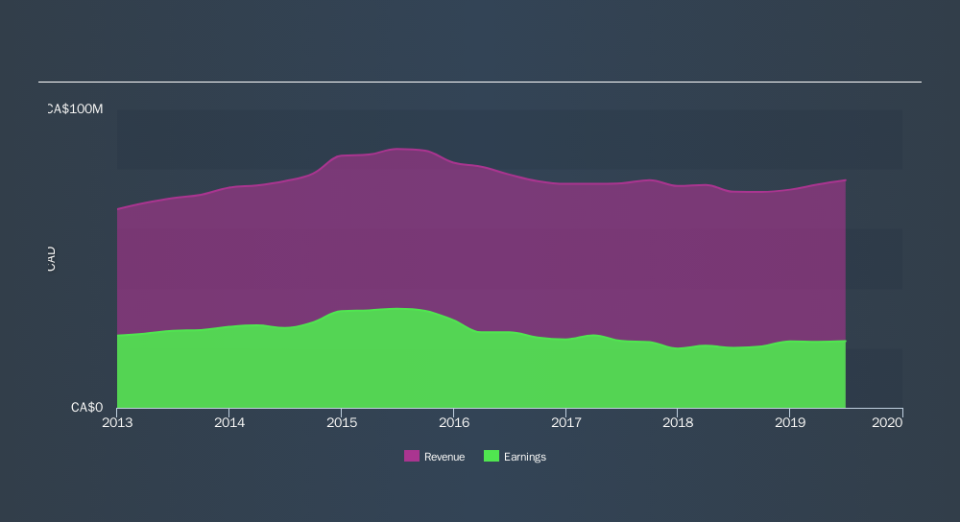
As it happens, Computer Modelling Group has a five year beta of 0.93. This is fairly close to 1, so the stock has historically shown a somewhat similar level of volatility as the market. If the future looks like the past, we could therefore consider it likely that the stock price will experience share price volatility that is roughly similar to the overall market. Share price volatility is well worth considering, but most long term investors consider the history of revenue and earnings growth to be more important. Take a look at how Computer Modelling Group fares in that regard, below.
Does CMG's size influence the expected beta?
Computer Modelling Group is a rather small company. It has a market capitalisation of CA$597m, which means it is probably under the radar of most investors. It doesn't take much money to really move the share price of a company as small as this one. That makes it somewhat unusual that it has a beta value so close to the overall market.
What this means for you:
Computer Modelling Group has a beta value quite close to that of the overall market. That doesn't tell us much on its own, so it is probably worth considering whether the company is growing, if you're looking for stocks that will go up more than the overall market. In order to fully understand whether CMG is a good investment for you, we also need to consider important company-specific fundamentals such as Computer Modelling Group’s financial health and performance track record. I urge you to continue your research by taking a look at the following:
Financial Health: Are CMG’s operations financially sustainable? Balance sheets can be hard to analyze, which is why we’ve done it for you. Check out our financial health checks here.
Past Track Record: Has CMG been consistently performing well irrespective of the ups and downs in the market? Go into more detail in the past performance analysis and take a look at the free visual representations of CMG's historicals for more clarity.
Other High-Performing Stocks: Are there other stocks that provide better prospects with proven track records? Explore our free list of these great stocks here.
We aim to bring you long-term focused research analysis driven by fundamental data. Note that our analysis may not factor in the latest price-sensitive company announcements or qualitative material.
If you spot an error that warrants correction, please contact the editor at editorial-team@simplywallst.com. This article by Simply Wall St is general in nature. It does not constitute a recommendation to buy or sell any stock, and does not take account of your objectives, or your financial situation. Simply Wall St has no position in the stocks mentioned. Thank you for reading.
