
 Yahoo Finance
 Computer Modelling Group Ltd.'s (TSE:CMG) Stock is Soaring But Financials Seem Inconsistent: Will The Uptrend Continue?
Computer Modelling Group (TSE:CMG) has had a great run on the share market with its stock up by a significant 10% over the last month. But the company's key financial indicators appear to be differing across the board and that makes us question whether or not the company's current share price momentum can be maintained. In this article, we decided to focus on Computer Modelling Group's ROE.
Return on equity or ROE is a key measure used to assess how efficiently a company's management is utilizing the company's capital. Put another way, it reveals the company's success at turning shareholder investments into profits.
Check out our latest analysis for Computer Modelling Group
How Is ROE Calculated?
The formula for return on equity is:
Return on Equity = Net Profit (from continuing operations) ÷ Shareholders' Equity
So, based on the above formula, the ROE for Computer Modelling Group is:
41% = CA$18m ÷ CA$44m (Based on the trailing twelve months to September 2021).
The 'return' refers to a company's earnings over the last year. That means that for every CA$1 worth of shareholders' equity, the company generated CA$0.41 in profit.
What Is The Relationship Between ROE And Earnings Growth?
Thus far, we have learned that ROE measures how efficiently a company is generating its profits. Based on how much of its profits the company chooses to reinvest or "retain", we are then able to evaluate a company's future ability to generate profits. Assuming all else is equal, companies that have both a higher return on equity and higher profit retention are usually the ones that have a higher growth rate when compared to companies that don't have the same features.
Computer Modelling Group's Earnings Growth And 41% ROE
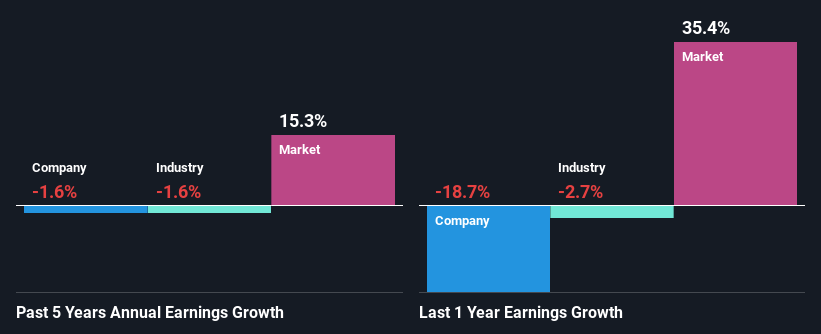
Firstly, we acknowledge that Computer Modelling Group has a significantly high ROE. Secondly, even when compared to the industry average of 14% the company's ROE is quite impressive. Given the circumstances, we can't help but wonder why Computer Modelling Group saw little to no growth in the past five years. So, there could be some other aspects that could potentially be preventing the company from growing. These include low earnings retention or poor allocation of capital
From the 1.6% decline reported by the industry in the same period, we infer that Computer Modelling Group and its industry are both shrinking at a similar rate.
Earnings growth is a huge factor in stock valuation. What investors need to determine next is if the expected earnings growth, or the lack of it, is already built into the share price. By doing so, they will have an idea if the stock is headed into clear blue waters or if swampy waters await. One good indicator of expected earnings growth is the P/E ratio which determines the price the market is willing to pay for a stock based on its earnings prospects. So, you may want to check if Computer Modelling Group is trading on a high P/E or a low P/E, relative to its industry.
Is Computer Modelling Group Efficiently Re-investing Its Profits?
Computer Modelling Group has a three-year median payout ratio as high as 133% meaning that the company is paying a dividend which is beyond its means. This does go some way in explaining the negligible earnings growth seen by Computer Modelling Group. Paying a dividend higher than reported profits is not a sustainable move. This is quite a risky position to be in. Our risks dashboard should have the 3 risks we have identified for Computer Modelling Group.
In addition, Computer Modelling Group has been paying dividends over a period of at least ten years suggesting that keeping up dividend payments is way more important to the management even if it comes at the cost of business growth.
Conclusion
On the whole, we feel that the performance shown by Computer Modelling Group can be open to many interpretations. Despite the high ROE, the company has a disappointing earnings growth number, due to its poor rate of reinvestment into its business. That being so, the latest industry analyst forecasts show that the analysts are expecting to see a huge improvement in the company's earnings growth rate. To know more about the latest analysts predictions for the company, check out this visualization of analyst forecasts for the company.
Have feedback on this article? Concerned about the content? Get in touch with us directly. Alternatively, email editorial-team (at) simplywallst.com.
This article by Simply Wall St is general in nature. We provide commentary based on historical data and analyst forecasts only using an unbiased methodology and our articles are not intended to be financial advice. It does not constitute a recommendation to buy or sell any stock, and does not take account of your objectives, or your financial situation. We aim to bring you long-term focused analysis driven by fundamental data. Note that our analysis may not factor in the latest price-sensitive company announcements or qualitative material. Simply Wall St has no position in any stocks mentioned.
