
 Yahoo Finance
 Companies Like Applied Therapeutics (NASDAQ:APLT) Could Be Quite Risky
We can readily understand why investors are attracted to unprofitable companies. For example, although Amazon.com made losses for many years after listing, if you had bought and held the shares since 1999, you would have made a fortune. But the harsh reality is that very many loss making companies burn through all their cash and go bankrupt.
So should Applied Therapeutics (NASDAQ:APLT) shareholders be worried about its cash burn? In this report, we will consider the company's annual negative free cash flow, henceforth referring to it as the 'cash burn'. The first step is to compare its cash burn with its cash reserves, to give us its 'cash runway'.
View our latest analysis for Applied Therapeutics
How Long Is Applied Therapeutics' Cash Runway?
A cash runway is defined as the length of time it would take a company to run out of money if it kept spending at its current rate of cash burn. As at March 2022, Applied Therapeutics had cash of US$56m and no debt. Importantly, its cash burn was US$93m over the trailing twelve months. Therefore, from March 2022 it had roughly 7 months of cash runway. To be frank, this kind of short runway puts us on edge, as it indicates the company must reduce its cash burn significantly, or else raise cash imminently. You can see how its cash balance has changed over time in the image below.
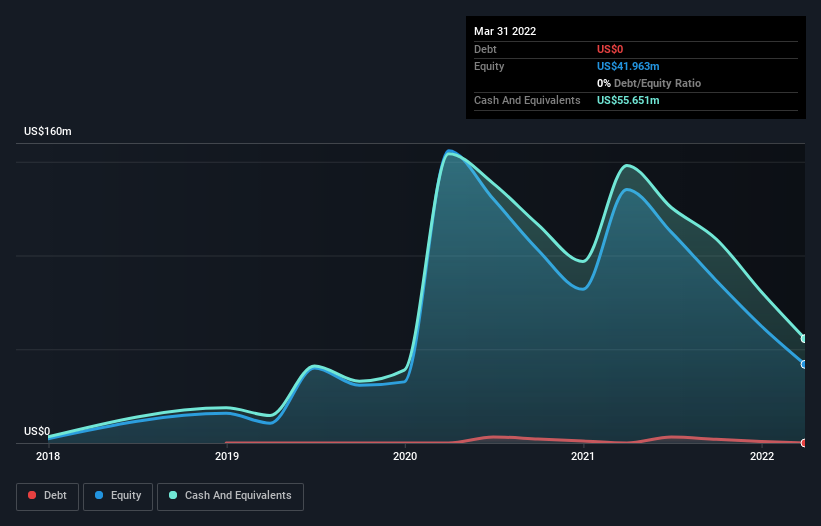
How Is Applied Therapeutics' Cash Burn Changing Over Time?
Applied Therapeutics didn't record any revenue over the last year, indicating that it's an early stage company still developing its business. Nonetheless, we can still examine its cash burn trajectory as part of our assessment of its cash burn situation. Over the last year its cash burn actually increased by 14%, which suggests that management are increasing investment in future growth, but not too quickly. However, the company's true cash runway will therefore be shorter than suggested above, if spending continues to increase. While the past is always worth studying, it is the future that matters most of all. For that reason, it makes a lot of sense to take a look at our analyst forecasts for the company.
How Easily Can Applied Therapeutics Raise Cash?
Given its cash burn trajectory, Applied Therapeutics shareholders should already be thinking about how easy it might be for it to raise further cash in the future. Issuing new shares, or taking on debt, are the most common ways for a listed company to raise more money for its business. Many companies end up issuing new shares to fund future growth. By looking at a company's cash burn relative to its market capitalisation, we gain insight on how much shareholders would be diluted if the company needed to raise enough cash to cover another year's cash burn.
Applied Therapeutics' cash burn of US$93m is about 322% of its US$29m market capitalisation. Given just how high that expenditure is, relative to the company's market value, we think there's an elevated risk of funding distress, and we would be very nervous about holding the stock.
How Risky Is Applied Therapeutics' Cash Burn Situation?
There are no prizes for guessing that we think Applied Therapeutics' cash burn is a bit of a worry. In particular, we think its cash burn relative to its market cap suggests it isn't in a good position to keep funding growth. While not as bad as its cash burn relative to its market cap, its increasing cash burn is also a concern, and considering everything mentioned above, we're struggling to find much to be optimistic about. After considering the data discussed in this article, we don't have a lot of confidence that its cash burn rate is prudent, as it seems like it might need more cash soon. On another note, Applied Therapeutics has 5 warning signs (and 2 which are potentially serious) we think you should know about.
If you would prefer to check out another company with better fundamentals, then do not miss this free list of interesting companies, that have HIGH return on equity and low debt or this list of stocks which are all forecast to grow.
Have feedback on this article? Concerned about the content? Get in touch with us directly. Alternatively, email editorial-team (at) simplywallst.com.
This article by Simply Wall St is general in nature. We provide commentary based on historical data and analyst forecasts only using an unbiased methodology and our articles are not intended to be financial advice. It does not constitute a recommendation to buy or sell any stock, and does not take account of your objectives, or your financial situation. We aim to bring you long-term focused analysis driven by fundamental data. Note that our analysis may not factor in the latest price-sensitive company announcements or qualitative material. Simply Wall St has no position in any stocks mentioned.
