
 Yahoo Finance
 CNH Industrial (NYSE:CNHI) shareholder returns have been splendid, earning 140% in 5 years
When you buy a stock there is always a possibility that it could drop 100%. But on a lighter note, a good company can see its share price rise well over 100%. For instance, the price of CNH Industrial N.V. (NYSE:CNHI) stock is up an impressive 128% over the last five years. Also pleasing for shareholders was the 10% gain in the last three months. But this could be related to the strong market, which is up 4.3% in the last three months.
On the back of a solid 7-day performance, let's check what role the company's fundamentals have played in driving long term shareholder returns.
See our latest analysis for CNH Industrial
To quote Buffett, 'Ships will sail around the world but the Flat Earth Society will flourish. There will continue to be wide discrepancies between price and value in the marketplace...' One imperfect but simple way to consider how the market perception of a company has shifted is to compare the change in the earnings per share (EPS) with the share price movement.
During the last half decade, CNH Industrial became profitable. Sometimes, the start of profitability is a major inflection point that can signal fast earnings growth to come, which in turn justifies very strong share price gains.
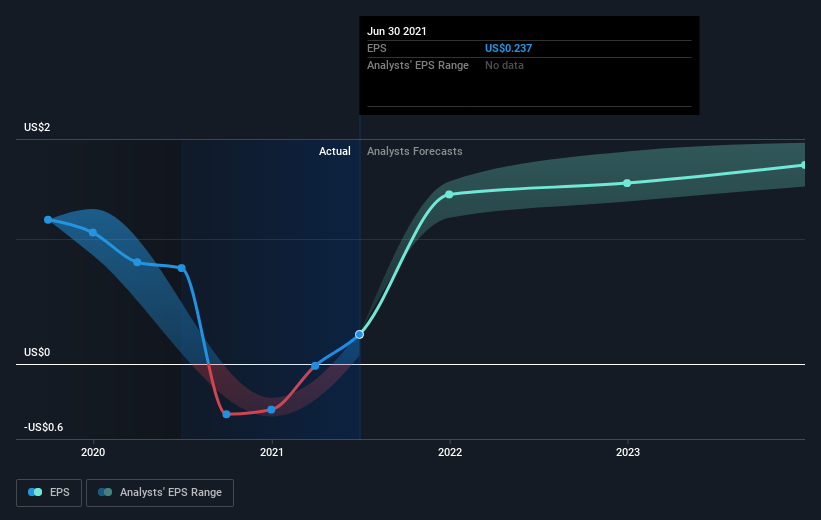
The company's earnings per share (over time) is depicted in the image below (click to see the exact numbers).
This free interactive report on CNH Industrial's earnings, revenue and cash flow is a great place to start, if you want to investigate the stock further.
What About Dividends?
As well as measuring the share price return, investors should also consider the total shareholder return (TSR). The TSR incorporates the value of any spin-offs or discounted capital raisings, along with any dividends, based on the assumption that the dividends are reinvested. Arguably, the TSR gives a more comprehensive picture of the return generated by a stock. As it happens, CNH Industrial's TSR for the last 5 years was 140%, which exceeds the share price return mentioned earlier. And there's no prize for guessing that the dividend payments largely explain the divergence!
A Different Perspective
We're pleased to report that CNH Industrial shareholders have received a total shareholder return of 114% over one year. Of course, that includes the dividend. That gain is better than the annual TSR over five years, which is 19%. Therefore it seems like sentiment around the company has been positive lately. Given the share price momentum remains strong, it might be worth taking a closer look at the stock, lest you miss an opportunity. While it is well worth considering the different impacts that market conditions can have on the share price, there are other factors that are even more important. Consider for instance, the ever-present spectre of investment risk. We've identified 3 warning signs with CNH Industrial , and understanding them should be part of your investment process.
For those who like to find winning investments this free list of growing companies with recent insider purchasing, could be just the ticket.
Please note, the market returns quoted in this article reflect the market weighted average returns of stocks that currently trade on US exchanges.
This article by Simply Wall St is general in nature. We provide commentary based on historical data and analyst forecasts only using an unbiased methodology and our articles are not intended to be financial advice. It does not constitute a recommendation to buy or sell any stock, and does not take account of your objectives, or your financial situation. We aim to bring you long-term focused analysis driven by fundamental data. Note that our analysis may not factor in the latest price-sensitive company announcements or qualitative material. Simply Wall St has no position in any stocks mentioned.
Have feedback on this article? Concerned about the content? Get in touch with us directly. Alternatively, email editorial-team (at) simplywallst.com.
