
 Yahoo Finance
 Chartwell Retirement Residences (TSE:CSH.UN) Will Be Hoping To Turn Its Returns On Capital Around
To avoid investing in a business that's in decline, there's a few financial metrics that can provide early indications of aging. Typically, we'll see the trend of both return on capital employed (ROCE) declining and this usually coincides with a decreasing amount of capital employed. Ultimately this means that the company is earning less per dollar invested and on top of that, it's shrinking its base of capital employed. Having said that, after a brief look, Chartwell Retirement Residences (TSE:CSH.UN) we aren't filled with optimism, but let's investigate further.
Return On Capital Employed (ROCE): What is it?
For those that aren't sure what ROCE is, it measures the amount of pre-tax profits a company can generate from the capital employed in its business. The formula for this calculation on Chartwell Retirement Residences is:
Return on Capital Employed = Earnings Before Interest and Tax (EBIT) ÷ (Total Assets - Current Liabilities)
0.022 = CA$64m ÷ (CA$3.4b - CA$509m) (Based on the trailing twelve months to December 2021).
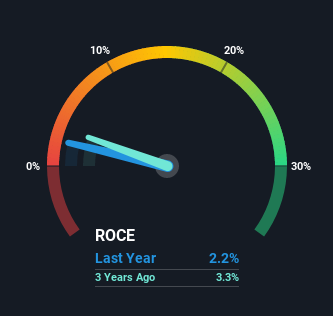
Thus, Chartwell Retirement Residences has an ROCE of 2.2%. Ultimately, that's a low return and it under-performs the Healthcare industry average of 9.1%.
Check out our latest analysis for Chartwell Retirement Residences
In the above chart we have measured Chartwell Retirement Residences' prior ROCE against its prior performance, but the future is arguably more important. If you'd like to see what analysts are forecasting going forward, you should check out our free report for Chartwell Retirement Residences.
So How Is Chartwell Retirement Residences' ROCE Trending?
In terms of Chartwell Retirement Residences' historical ROCE movements, the trend doesn't inspire confidence. About five years ago, returns on capital were 3.3%, however they're now substantially lower than that as we saw above. On top of that, it's worth noting that the amount of capital employed within the business has remained relatively steady. This combination can be indicative of a mature business that still has areas to deploy capital, but the returns received aren't as high due potentially to new competition or smaller margins. So because these trends aren't typically conducive to creating a multi-bagger, we wouldn't hold our breath on Chartwell Retirement Residences becoming one if things continue as they have.
The Bottom Line On Chartwell Retirement Residences' ROCE
All in all, the lower returns from the same amount of capital employed aren't exactly signs of a compounding machine. And long term shareholders have watched their investments stay flat over the last five years. Unless there is a shift to a more positive trajectory in these metrics, we would look elsewhere.
One more thing: We've identified 4 warning signs with Chartwell Retirement Residences (at least 1 which doesn't sit too well with us) , and understanding these would certainly be useful.
If you want to search for solid companies with great earnings, check out this free list of companies with good balance sheets and impressive returns on equity.
Have feedback on this article? Concerned about the content? Get in touch with us directly. Alternatively, email editorial-team (at) simplywallst.com.
This article by Simply Wall St is general in nature. We provide commentary based on historical data and analyst forecasts only using an unbiased methodology and our articles are not intended to be financial advice. It does not constitute a recommendation to buy or sell any stock, and does not take account of your objectives, or your financial situation. We aim to bring you long-term focused analysis driven by fundamental data. Note that our analysis may not factor in the latest price-sensitive company announcements or qualitative material. Simply Wall St has no position in any stocks mentioned.
